San Francisco Market Cycles
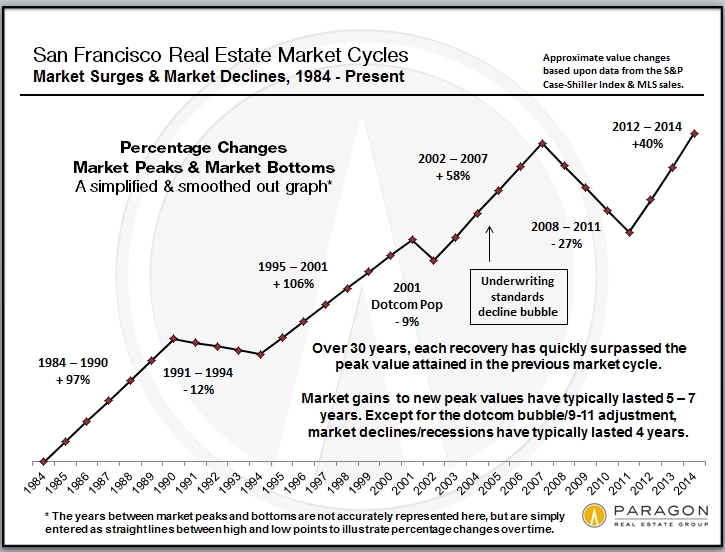
Here is a simplified and smoothed out graph of the last 30 years of real estate cycles. It is based upon percentage increases and decreases from peak value and low points. I think it does help give greater context to the our current market. Note that percentage declines and increases are not created equal: If prices decline 30%, they have to go back up 43% to get back to where they were. Over the past 30+ years, the period between a recovery beginning and a major “market adjustment” (or bubble popping) has run 5 to 7 years. We are currently about 2.5 years into the current recovery.
Periods of market recession/doldrums following the popping of a bubble have typically lasted about 4 years. (The 2001 dotcom bubble and 9-11 crisis drop being the exception.) Generally speaking, within about 2 years of a new recovery commencing, previous peak values (i.e. those at the height of the previous bubble) are re-attained – among other reasons, there is the recapture of inflation during the doldrums years and simple pent-up demand.
Do not hesitate to email / call with any questions.