A statistical breakdown by household income, education, homeownership,foreign-born population, household size, age and other criteria.
June 2014 Report
The below charts and table are based upon U.S. Census surveys from 2010 – 2013. Please note that zip codes often contain neighborhoods of widely different demographics. For example, 94115 includes Pacific Heights, one of the most affluent areas of the city, as well the Western Addition, which is much less affluent. A number of SF zip codes are like this and when mixing very different neighborhoods together, you often end up with statistics that don’t really apply to any of them. Zip codes are relatively blunt instruments for demographic investigation, but we still found the analysis to generate interesting, new insights into San Francisco, our ever-changing city.
Each chart illustrates the data for 10 to 12 SF zip codes. Below the charts is a complete table of all the data collected.
The neighborhoods associated with zip codes in the charts and table below are simply representative labels; other neighborhoods are contained within each zip code and many are divided between two or more zip codes.
Median Household Income Many factors impact this statistic: household size, level of education, percentages of homeowners vs. renters, whether the rental units are subject to rent control, median resident age, quality of housing, and cost-of-housing issues besides rent control. The South Beach-Yerba Buena zip code takes top place for median household income in San Francisco. Interestingly, it is at the
bottom of the ranking for average household size. This zip code is dominated by newer condo projects, many of them at the top of the price scale and the rental units here, which make up over half the housing, are typically not under rent control. The second ranked zip code for income is quite different: the St. Francis Wood-Miraloma Park area has a completely different ambiance, very few condos or renters, older residents and bigger households. And number 3 is the Presidio Trust zip code with no homeowners, all renters but no rent control, and younger residents than either of the first two. All 3 of the top zip codes, however, have very high percentages of residents with bachelor’s, graduate and professional degrees.

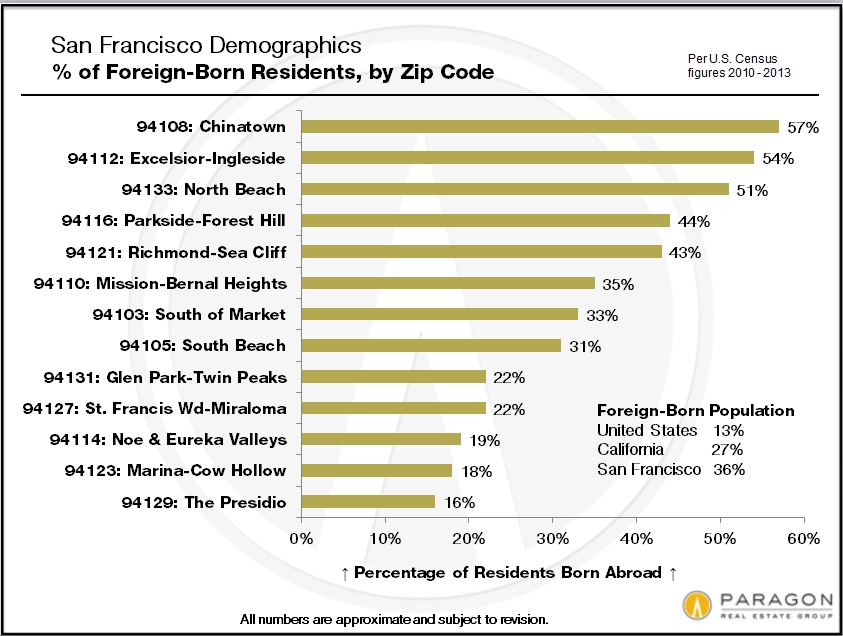
Foreign-Born Percentage of Population Of major metro areas, San Francisco ranks 4th in the country in percentage of foreign-born residents. In three of the city’s zip codes, foreign-born residents constitute a small majority.
Percentage of Housing Units Owner-Occupied San Francisco has approximately 70% more housing units occupied by renters than by homeowners. By zip code, homeownership percentages in the city range from 0% (100% renters) to over 80%.
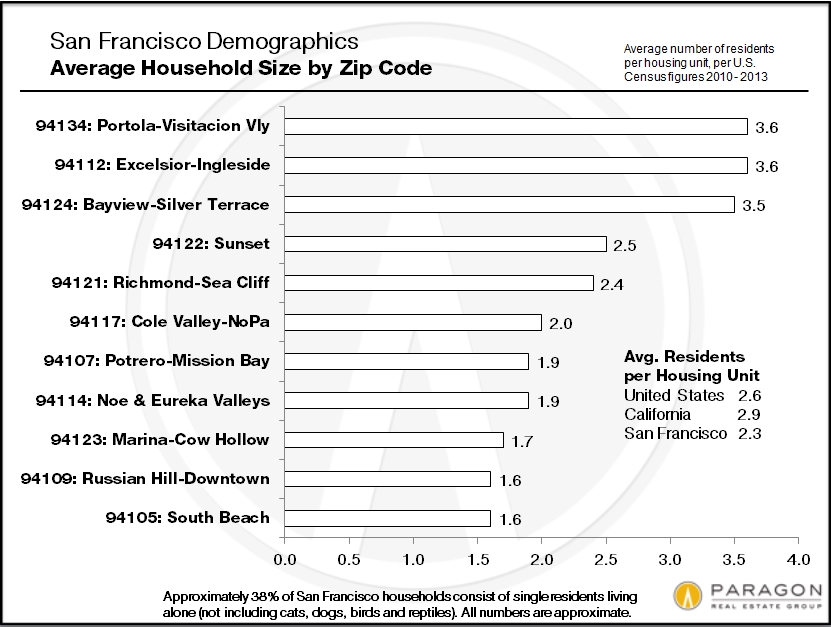
Average Size of Household San Francisco has the lowest percentage of children of any major U.S. city and 38% of residents live alone. This brings the city’s average household size down, however the statistic varies widely by zip code, ranging from 1.6 to 3.6 residents per household.
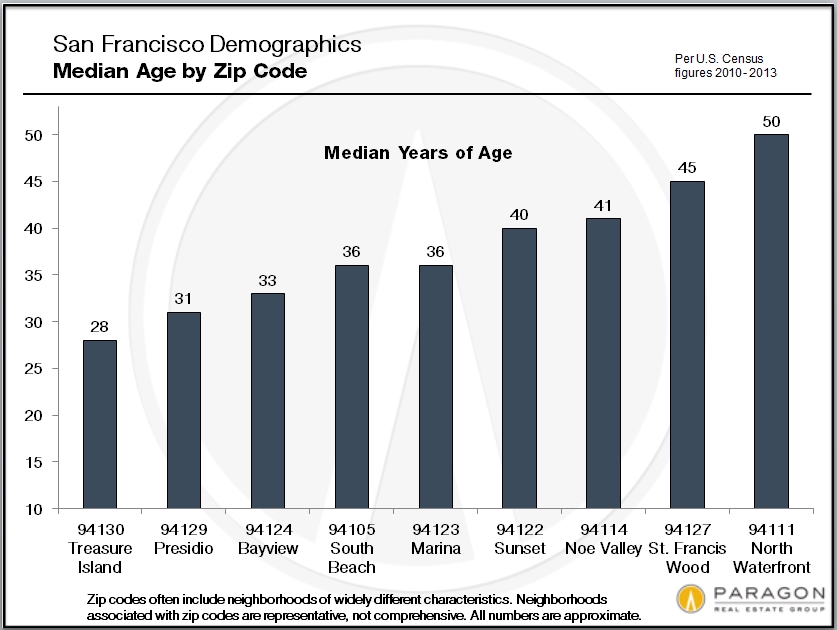
Median Age of ResidentsThe youngest zip codes in San Francisco are those that are 100% rental: the Presidio and Treasure Island. The oldest zip code is the area of the North Waterfront and Barbary Coast, just north of the financial district along the Embarcadero. Second oldest is Chinatown (47 years) and the third oldest is the St. Francis Wood-Miraloma Park area.
Zip Code Demographics Data TableZip codes in the table below are in order of median household income.
The demographics of San Francisco are constantly changing, so
consider the numbers in these analyses to be general estimates.
This report was created in good faith and is based on data from sources deemed reliable,
but may contain inadvertent errors and misrepresentations, and is subject to revision.
© June 2014 Paragon Real Estate Group