September 2021 Market Report

Image by Christopher Michel on Flickr, via Creative Commons license
San Francisco Housing Costs since the Pandemic
Percentage Price Changes vs. 2019: Houses, Condos, Apartments*

Approximate, good-faith estimates
Median 3-BR house prices up 13% from 2019
Median 2-BR condo prices flat compared to 2019, but up from 12/20
Avg. asking rents down 17% from 2019, but up from 12/20 low
Economists generally believe there should be a 15 rational equilibrium in the cost of housing of % different housing types. But after the pandemic hit, supply and demand shifted dramatically: SF median 10% house prices are now up 13%, condo prices are flat, and rents down 17%. However, in 2021 all 3 have 5% been rebounding in close to parallel trend lines.*
* Comparing 3-month-rolling median sales prices in July 2021 with July 2019 and December 2020 for 3-BR houses (1500-2000 sq.ft.) and 2-BR condos (900 — 1500 sq.ft.), per sales reported to NorCal Regional MLS per Infosparks. Average rents compare July 2021 with the 2019 average and with December 2020, all unit sizes, per Apartment List. Approximate, good-faith estimates using data from sources deemed reliable, but may contain errors and subject to revision.
San Francisco Home Sales Breakdown
6 Months Sales by Property Type & Bedroom Count

Median Sales Prices & Median $/Sq.Ft.
2-BR Houses - $1,400,000, 1150 sq.ft., $1101/sq.ft.
3-BR Houses - $1,785,000, 1605 sq.ft., $1049/sq.ft.
4-BR Houses - $2,460,000, 2345 sq.ft., $1016/sq.ft.
5+ BR Houses - $3,260,000, 3275 sq.ft., $958/sq.ft.
Studio Condos - $540,000, 474 sq.ft., $1085/sq.ft.
1-BR Condos - $850,000, 759 sq.ft., $1063/sq.ft.
2-BR Condos - $1,340,500, 1160 sq.ft., $1096/sq.ft. (More 2-BR condos sell in SF than any other property type)
3-BR Condos - $1,797,500, 1636 sq.ft., $1055/sq.ft
4-BR Condos - $2,299,000, 2265 sq.ft., $1002/sq.ft.
2-Unit Bldgs - $1,997,500, $726/sq.ft.
In this analysis, "condos" include co-op sales as well. Median 3275 sq.ft.
Does not include new-project condo sales unreported to MLS. Based upon data sources deemed reliable, but may contain errors and subject to revision. All numbers should be considered approximate.
6 months sales reported to NorCal Regional MLS through 8/15/21
San Francisco Market Dynamics
Median HOUSE Sales Prices, 3-Month Rolling

Median house sales prices as reported to NorCal Regional MLS, per Infosparks. Median sales prices can fluctuate due to factors besides changes in fair market value. Analysis may contain errors and subject to revision. All numbers are approximate. Latest data may change due to late-reported sales.
Closed sales generally reflect offers accepted in the previous month. Median sales prices often fluctuate by season, and it's not unusual for them to peak for the year in spring, though in 2021 YTD, July was the peak (by a tad).
San Francisco House Values, Selected Neighborhoods & Districts
2021 Median House Sales Prices — 6 Months Sales*

* Sales reported to NorCal Regional MLS in the 6-month period through late August 2021. Data from sources deemed reliable, but may contain errors and subject to revision. Late reported sales may alter these figures. All numbers approximate.
Median sales price is that price where half the homes sold for more and half for less. It is a very general statistic that typically disguises a wide range of prices in the underlying sales.
* With 70-odd neighborhoods and only 1620 house sales in the 6-month period, most SF neighborhoods did not have enough sales of these bedroom/bath counts for reliable median sales price calculation.
San Francisco House Sales
6 Months House Sales by Price Segment*

* 6 months NorCal Regional MLS house sales reported through 8/15/21. Data derived from sources deemed reliable, but may contain errors and subject to revision. All numbers approximate. Not all sales are reported to MLS.
Percentage of Sales
Under $1,000,000: 4.5%
$1,000,000 - $1,499,999: 25%
$1,500,000 - $1,999,999: 26%
$2,000,000 - $2,999,999: 24%
$3,000,000 - $3,999,999: 9.5%
$4,000,000 - $4,999,999: 5%
$5,000,000 - $6,999,999: 3.5%
$7,000,000 - $9,999,999: 1.5%
$10,000,000 & above: 1%
Median CONDO Sales Prices, 3-Month Rolling, since February 2017

Median sales price is that price at which half the sales occurred for more and half for less. It is a general statistic that conceals a wide range of prices in the underlying sales. It can be affected by factors other than changes in fair market value and often fluctuates.
San Francisco Condo, Co-op, Townhouse & TIC Sales
6 Months Sales by Price Segment*

* 6 months NorCal Regional MLS condo, co-op, TIC, townhouse sales reported through 8/15/21. Data derived from sources deemed reliable, but may contain errors and subject to revision. All numbers approximate. Not all sales are reported to MLS, especially many new-project condo sales. Percentages are rounded to nearest whole percentage point.
Percentage of Sales
Under $700,000: 11%
$700,000 - $999,999: 24%
$1,000,000 - $1,249,999: 16%
$1,250,000 - $1,499,999: 17%
$1,500,000 - $1,999,999: 19%
$2,000,000 - $2,499,999: 6%
$2,500,000 - $2,999,999: 3%
$3,000,000 - $3,999,999: 2%
$4,000,000 & above: 1%
San Francisco Home Sales Change
Year-over-Year Percentage Increases, 12 Months Sales Volume by Price Segment

*Residential — house, condo, co-op, TIC, townhouse — sales reported to NorCal Regional MLS, August through July of 2 successive 12-month periods within 2019-2021, per Infosparks. Data from sources deemed reliable, but may contain errors and subject to revision. All numbers approximate.
All price segments saw significant year-over-year percentage increases in sales volume over the past 12 months, with homes selling for $5,000,000+ soaring 172%.
The 85% increase in homes selling for under $1,000,000 reflects the large rebound in condo sales after the initial post-pandemic plunge.
Major Market Factors since Spring 2020
Abnormally high household movement occurred due to pandemic-related, population-density reasons, housing and living costs, family and quality of life issues, and new wealth — moves greatly enabled by work-from-home. There was a considerable increase in the number of buyers for first homes, larger homes and luxury homes. Since Covid and its population density issues, house prices are well up, condo prices are flat (after initially plunging after the pandemic hit), and rents well down. (Rental units make up the majority of SF housing.)
New wealth: Federal and state governments shoveled trillions of dollars to businesses and households, many of which were in no financial distress. Financial markets soared, dramatically increasing the personal wealth of middle class and more affluent households. And house values climbed. These factors contributed to the sense of being wealthier than ever, which helped supercharge the housing market. The households which did suffer financial hardship were generally less affluent, and more likely to be tenants than homeowners or homebuyers: Their misfortunes and the work-from-home policies of high-tech companies deeply impacted the SF rental market, though it too began to recover since the rollout of vaccines.
Interest rates: The Fed implemented policies that brought mortgage interest rates down to historic lows, significantly lowering housing costs, and motivating prospective homebuyers to buy sooner than later. (The risk is that if interest rates jump, perhaps due to inflationary pressures — and we are not saying they will — it could have pronounced cooling effect on the market, as it did in mid-late 2018.)
Optimism boosts housing and financial markets: Markets typically move in cycles characterized by pervasive economic optimism, uncertainty or pessimism, and today, optimism generally prevails among those with financial resources. Because there are so many economic, political and ecological factors at play at any given time, it is extremely difficult to predict the timing, duration or magnitude of market cycles up or down.
Demographic shifts: According to census data, many more less-affluent/less-educated residents left CA than have arrived in the 10 years through 2019, but more higher-income/more-educated residents arrived than departed. Out-migration accelerated in San Francisco since Covid hit, especially of less affluent residents — unemployment hit lower-wage jobs the hardest — though departures by affluent households seeking less densely populated locations also occurred. However, SF saw heightened demand for houses (with their yards and decks) by affluent and very affluent buyers competing for an inadequate supply of listings for sale. The condo market began a very dramatic rebound with the rollout of vaccines in 2021, hitting new highs is sales volume.
New Listings Coming on Market
San Francisco Market Dynamics & Seasonality

Per Realtor.com Research: https://www.realtor.com/research/data/, listings posted on site. Data from sources deemed reliable, but may contain errors and subject to revision. All numbers should be considered approximate.
New listings ebb and flow by season: They typically drop in mid-summer, and then spike back up — September is usually the single month with the most new listings. After autumn, new listings plunge to their low point in December.
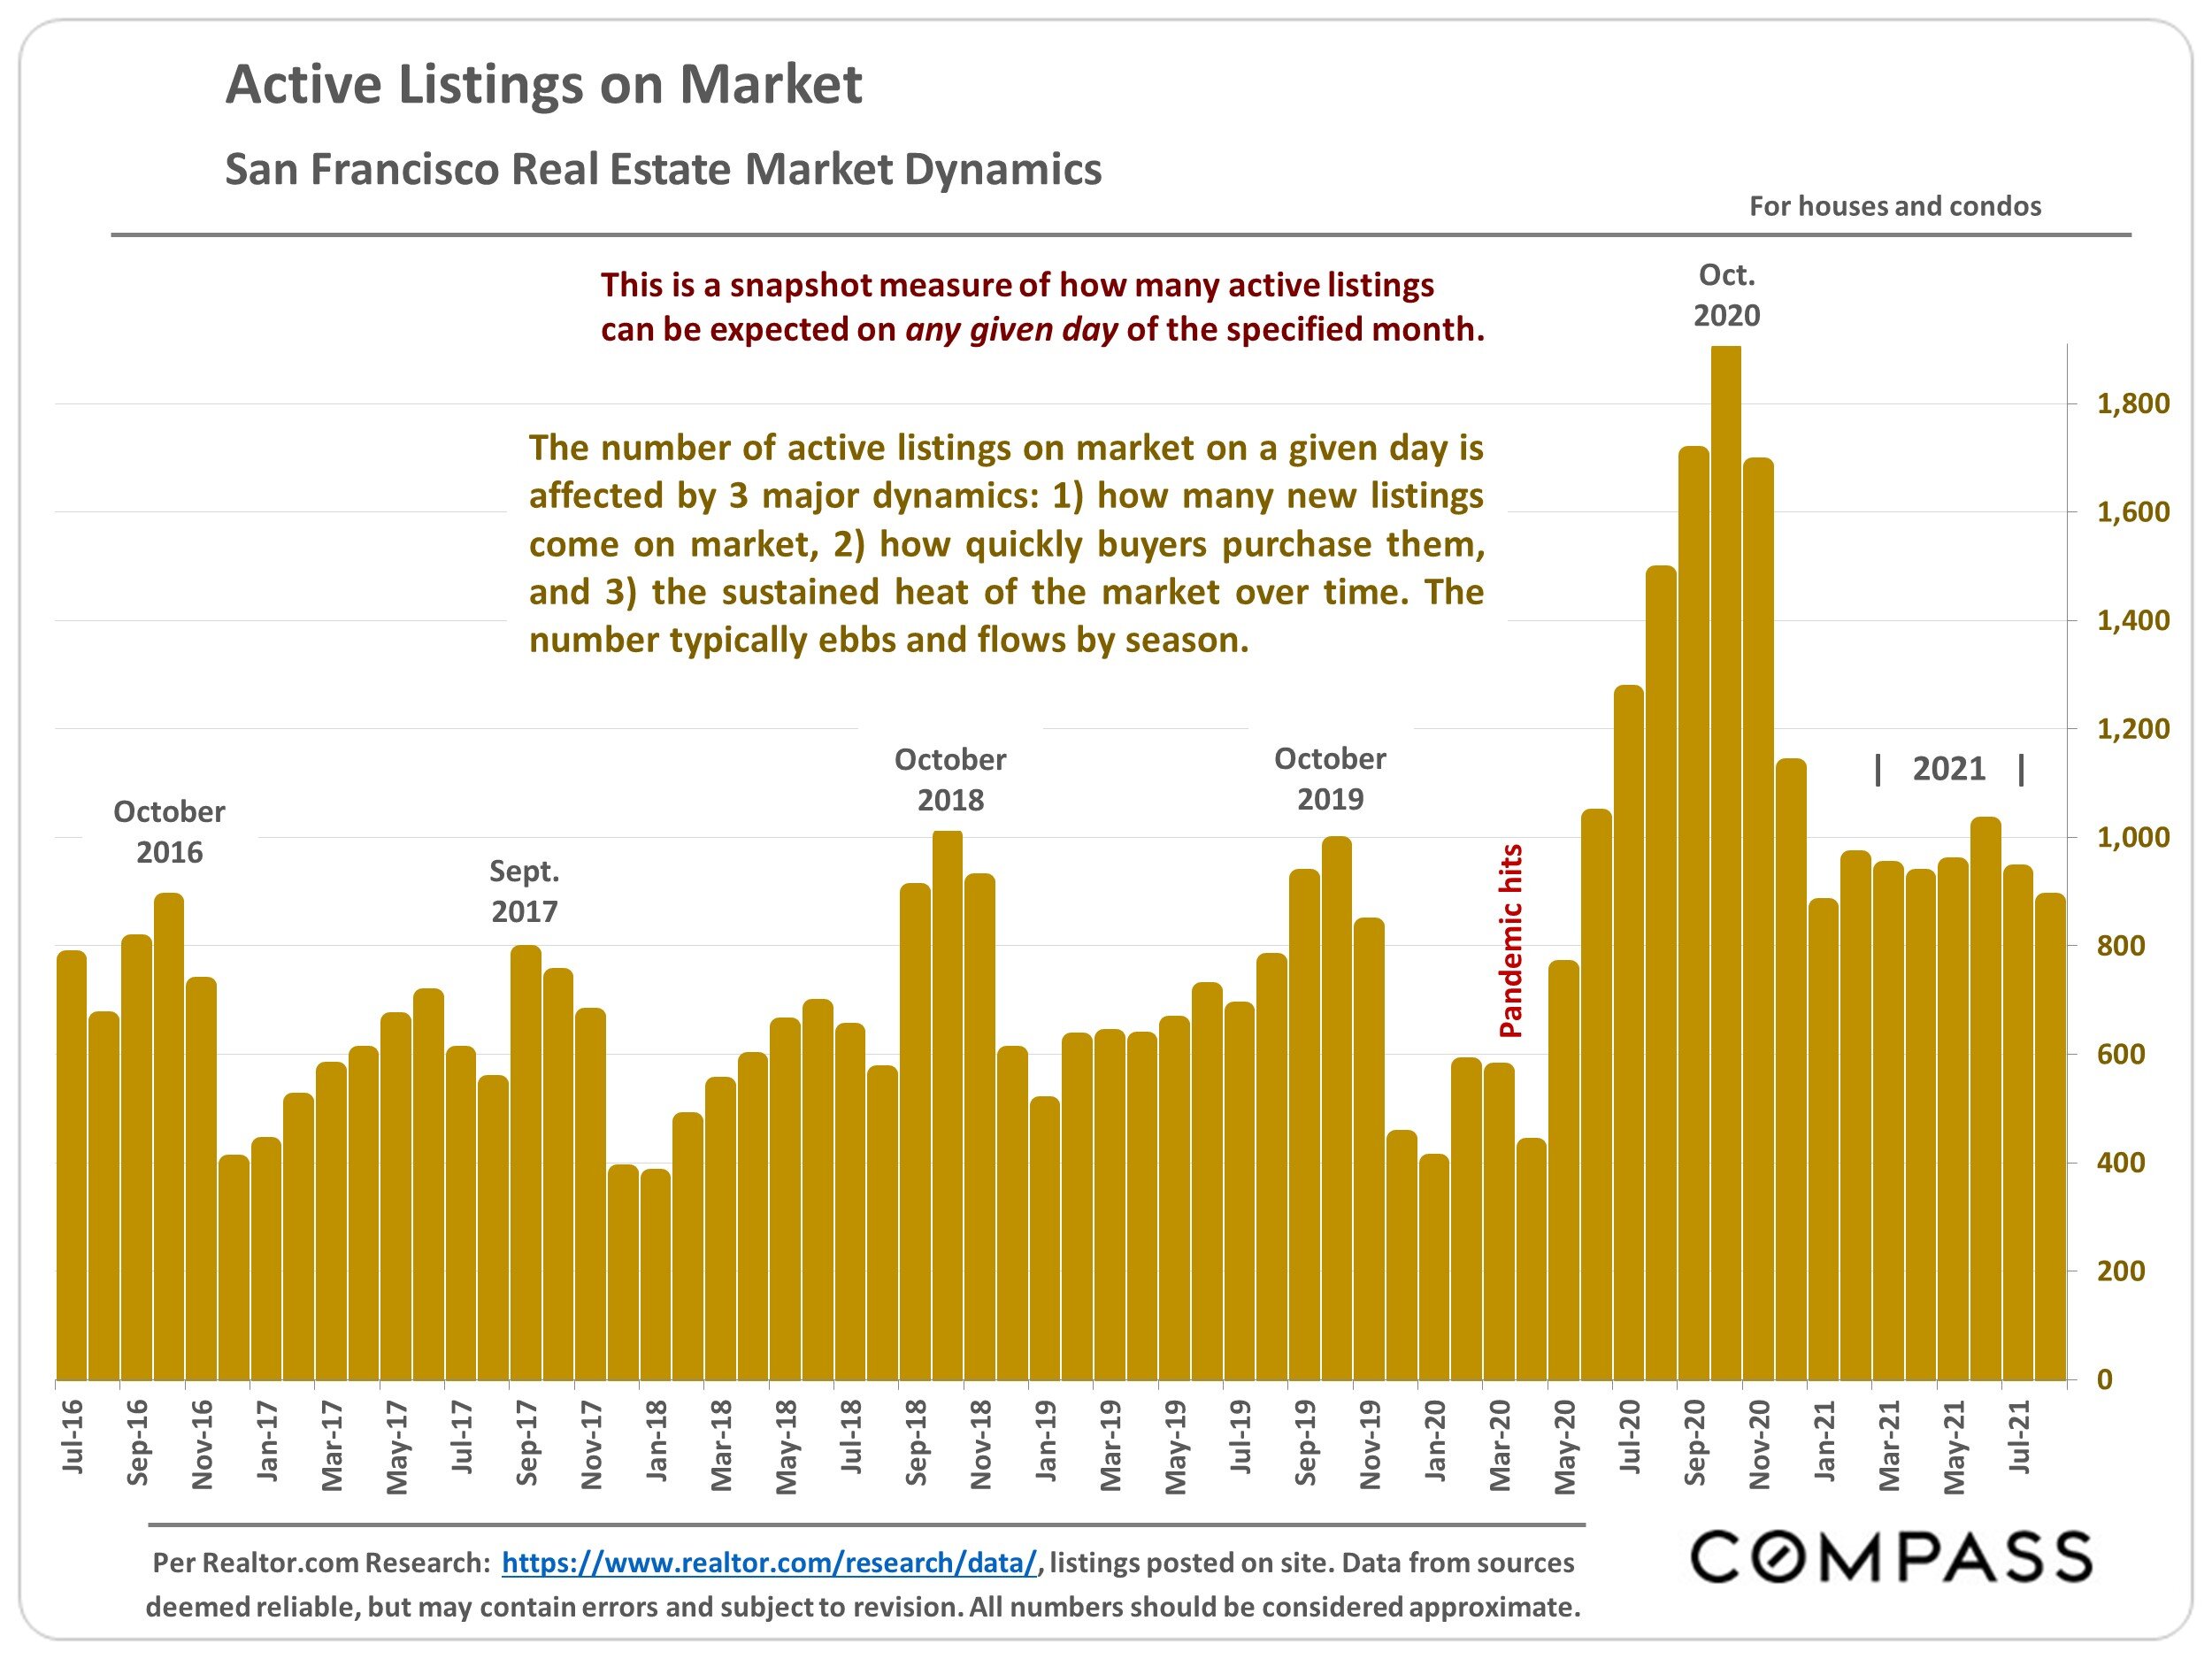
Active Listings on Market
San Francisco Real Estate Market Dynamics
Per Realtor.com Research: https://www.realtor.com/research/data/, listings posted on site. Data from sources deemed reliable, but may contain errors and subject to revision. All numbers should be considered approximate.
This is a snapshot measure of how many active listings can be expected on any given day of the specified month.
The number of active listings on market on a given day is affected by 3 major dynamics: 1) how many new listings come on market, 2) how quickly buyers purchase them, and 3) the sustained heat of the market over time. The number typically ebbs and flows by season.
Unit Home Sales by Month since 2018

House, condo, townhouse, co-op and TIC sales reported to NorCal Regional MLS, per Infosparks. Data from sources deemed reliable but may contain errors and subject to revision. All numbers approximate. Latest data estimated and may change due to late-reported sales.
Market activity typically ebbs and flows by season, peaking in spring and fall, falling in summer and winter (though the pandemic upended normal seasonal trends in 2020). Closed sales are a lagging indicator: Sales closing in one month generally reflect accepted offers in the previous month. The surge in listings in September fuels the October surge in sales.
San Francisco Luxury Home Sales
Homes Selling for $3 Million & Above, by Month

House, condo, townhouse, co-op and TIC sales reported to NorCal Regional MLS, per Infosparks. Data from sources deemed reliable but may contain errors and subject to revision. All numbers approximate. Latest month's data estimated and may change due to late-reported sales.
Sales in one month mostly reflect market activity (offers being accepted) in the previous month. Luxury home sales typically peak in spring and fall, declining in mid-summer and plunging in mid-winter. (The pandemic changed typical seasonal trends in 2020.)
San Francisco Luxury Home Market
2021 YTD Sales by Neighborhood, $5,000,000 & Above*

House, condo & co-op listings reported as sold year-to-date, or under contract as of 8/22/21
2021 YTD, as of 8/22/21, there were 60 active listings of $5 million+ in MLS, 6 in contract, and 124 sold.
At $10 million+, there were 18 active listings, and 16 sold YTD. 22 of these are located in Cow Hollow, Pacific & Presidio Heights.
Other neighborhoods has 2 or fewer $5 million+ sales: Sea Cliff, Jordan Park, St. Francis Wood, Lower Pacific Heights, Yerba Buena, Mission Dolores, Inner Mission, Diamond Heights, Corona Heights, Outer Parkside.
The highest sale reported YTD was in Presidio Heights at $24,950,000; the next was in Pacific Heights at $19,500,000. The highest priced active listing is in Cow Hollow at $46 million.
September is typically one of the most active months for new luxury home listings coming on market, which then fuels sales during the short fall selling season.
* House, condo, co-op activity reported to NorCal Regional MLS in 2021 by 8/22/21. Data from sources deemed reliable, but may contain errors and subject to revision. Not all luxury home sales are reported to MIS, and late-reported activity may alter these numbers. Numbers can change on a daily basis. All numbers are approximate.
Price Reductions on Active Listings

Per Realtor.com Research: https://www.realtor.com/research/data/. Data from sources deemed reliable, but may contain errors and subject to revision. All numbers should be considered approximate.
The number of price reductions usually climbs at the end of the spring selling season before the market (typically) slows down for summer, and surges at the end of the autumn selling season before the (usual) big mid-winter slowdown. (In 2020, with the pandemic, sales volume peaked in December.)
Year-over-Year Median House Sales Price Increases
by Bay Area County, Q2 2021 vs. Q2 2020

Data per California Association of Realtors: "C.A.R.'s Traditional Housing Affordability Index (HAI). Methodology can be found on www.CAR.org, Market Data section. "SF Bay Area" includes 9 counties, Napa to Santa Clara.
Median price is that price at which half the sales occurred for more and half for less. It is a very general statistic that typically disguises an enormous range of sales prices in the individual underlying sales. It may fluctuate for reasons other than changes in fair market value, and should not be considered an exact measurement of changes in fair market value. Seasonal fluctuations in median sales prices are very common.
CA Migration by Income & Education
Net Domestic, Inter-State Population Movement, 2010-2019

Based upon analysis of ACS data by Hans Johnson, Public Policy Institute of CA, May 2021 (does not include foreign immigration figures): https://www.ppic.org/blog/whos-leaving-california-and-whos-moving-in/. Adults 20-64 years of age. Low income: up to twice federal poverty level; mid-income: more than 2, up to 5 times poverty level; higher income: more than 5 times poverty level. Data from sources deemed reliable but may contain errors.
The less affluent/less educated have been leaving CA; the more affluent/more educated still arriving. The out-migration of lower income/education residents has almost certainly accelerated since Covid, esp. in more expensive housing markets.
2010-2014. Income: 253,000 more low/mid-income adults left CA than arrived. 64,200 more higher-income adults arrived than left. Education: 311,900 more adults with less than a bachelor's degree left than arrived. 80,100 more adults with Bachelor's degrees+ arrived than departed.
2015-2019. Income: 414,900 more low/mid-income adults left CA than arrived. 49,400 more higher-income adults arrived than left. Education: 465,500 more adults with less than a bachelor's degree left than arrived. 74,500 more adults with Bachelor's degrees+ arrived than departed.
American Community Survey (ACS) estimates: Does not include foreign immigration, a big factor in CA and Bay Area since 2010.
Consumer Price Index 12-Month Percentage Change, Past 20 Years

Chart from U.S. Bureau of Labor Statistics, published mid-August 2021: https://www.b1s.govicharts/consumer-price-index/consumer-price-index-by-category-line-chart.htm. Data from sources deemed reliable, but may contain errors and subject to revision.
As the economic recovery from the pandemic has accelerated, the Consumer Price Index, a measurement of inflation, has seen large increases.
Historically, the standard remedy for surging inflation is to raise interest rates, however there are many opinions as to whether higher-than-normal inflation rates will persist and become a significant economic issue requiring response by the Federal Reserve Bank in the near future. Predicting interest rate changes is extremely difficult. Certainly, this is an economic indicator to watch in coming months.
Statistics are generalities, essentially summaries of widely disparate data generated by dozens or hundreds of unique, individual sales occurring within different time periods. They are best seen not as precise measurements, but as broad, comparative indicators, with reasonable margins of error. Anomalous fluctuations in statistics are not uncommon, especially in smaller, expensive market segments. Data from sources deemed reliable, but may contain errors and subject to revision. All numbers are approximate. Data from MLS, but not all listings or sales are reported to MLS.
Median Sales Price is that price at which half the properties sold for more and half for less. It may be affected by seasonality, "unusual" events, or changes in inventory and buying trends, as well as by changes in fair market value. The median sales price for an area will often conceal an enormous variety of sales prices in the underlying individual sales.
Dollar per Square Foot is based upon the home's interior living space and does not include garages, unfinished attics and basements, rooms built without permit, patios, decks or yards (though all those can add value to a home). These figures are usually derived from appraisals or tax records, but are sometimes unreliable (especially for older homes) or unreported altogether. The calculation can only be made on those home sales that reported square footage.
Many aspects of value cannot be adequately reflected in median and average statistics: curb appeal, age, condition, amenities, views, lot size, quality of outdoor space, "bonus" rooms, additional parking, quality of location within the neighborhood, and so forth. How these statistics apply to any particular home is unknown without a specific comparative market analysis.
Compass is a real estate broker licensed by the State of California, DRE 01527235. Equal Housing Opportunity. This report has been prepared solely for information purposes. The information herein is based on or derived from information generally available to the public and/or from sources believed to be reliable. No representation or warranty can be given with respect to the accuracy or completeness of the information. Compass disclaims any and all liability relating to this report, including without limitation any express or implied representations or warranties for statements contained in, and omissions from, the report. Nothing contained herein is intended to be or should be read as any regulatory, legal, tax, accounting or other advice and Compass does not provide such advice. All opinions are subject to change without notice. Compass makes no representation regarding the accuracy of any statements regarding any references to the laws, statutes or regulations of any state are those of the author(s). Past performance is no guarantee of future results.