November 2021 Market Report

Photo by Charles Lewis III on Flickr, via Creative Commons
As the year begins to wind down and move into the mid-winter holidays, the market typically slows down as well: The number of new listings declines, to finally plunge in December, with sales volume following one step behind. Price reductions often jump, and some listings, especially of more expensive homes, are pulled off the market until the market wakes up in the new year — usually in late January or February depending on the weather and other factors. Of course, buying and selling occur at all times of the year, including in mid-winter, but commonly at a much reduced rate. Note that typical market seasonality was often upended in 2020 due to the pandemic; more normal seasonal trends seem to have returned in 2021.
For buyers, the coming months can offer substantial opportunities in the form of reduced competition, fewer multiple offers, less overbidding, more room to negotiate, and often significantly better deals. This is an excellent time for buyers to take a second look at listings that haven't sold, and to make aggressive offers.
This report will review home price appreciation by property type in selected city neighborhoods, supply and demand dynamics as illustrated by a variety of statistical measures, luxury home sales, and a survey of selected macroeconomic indicators.
The following charts review approximate house sales price changes since 1990, breaking down percentage ups and downs during periods such as the dotcom era, the subprime bubble, the recent high-tech boom, and the pandemic. Readings on the chart refer not to specific prices, but to the 01 2000 median sales price, assigned a value of 100: A reading of 180 signifies the median house price has increased by 80% since January 2000.
San Francisco Home Price Appreciation
Monthly Median House Sales Prices, 6-Month Rolling Average, since 1990

Median sales price is that price at which half the sales occurred for more and half for less. It is a very general statistic often affected by factors other than changes in fair market value. Seasonal fluctuations are common. Longer-term trends are more meaningful than short-term changes.
San Francisco Median Home Price Appreciation since 1990
Median HOUSE Sales Price Change, Indexed to Q1 2000.
Sales reported through 9/30/21. All numbers are approximate.

Because they fluctuate due to a number of factors, changes in median sales prices are very approximate indicators of changes in fair market value. The county includes many diverse market segments varying in affluence, values and appreciation rates. How this chart applies to any particular home is unknown without a specific comparative market analysis.
San Francisco Median Condo Sales Price Trends
Monthly Median Sales Prices since 2005 - 6-Month Rolling Figures
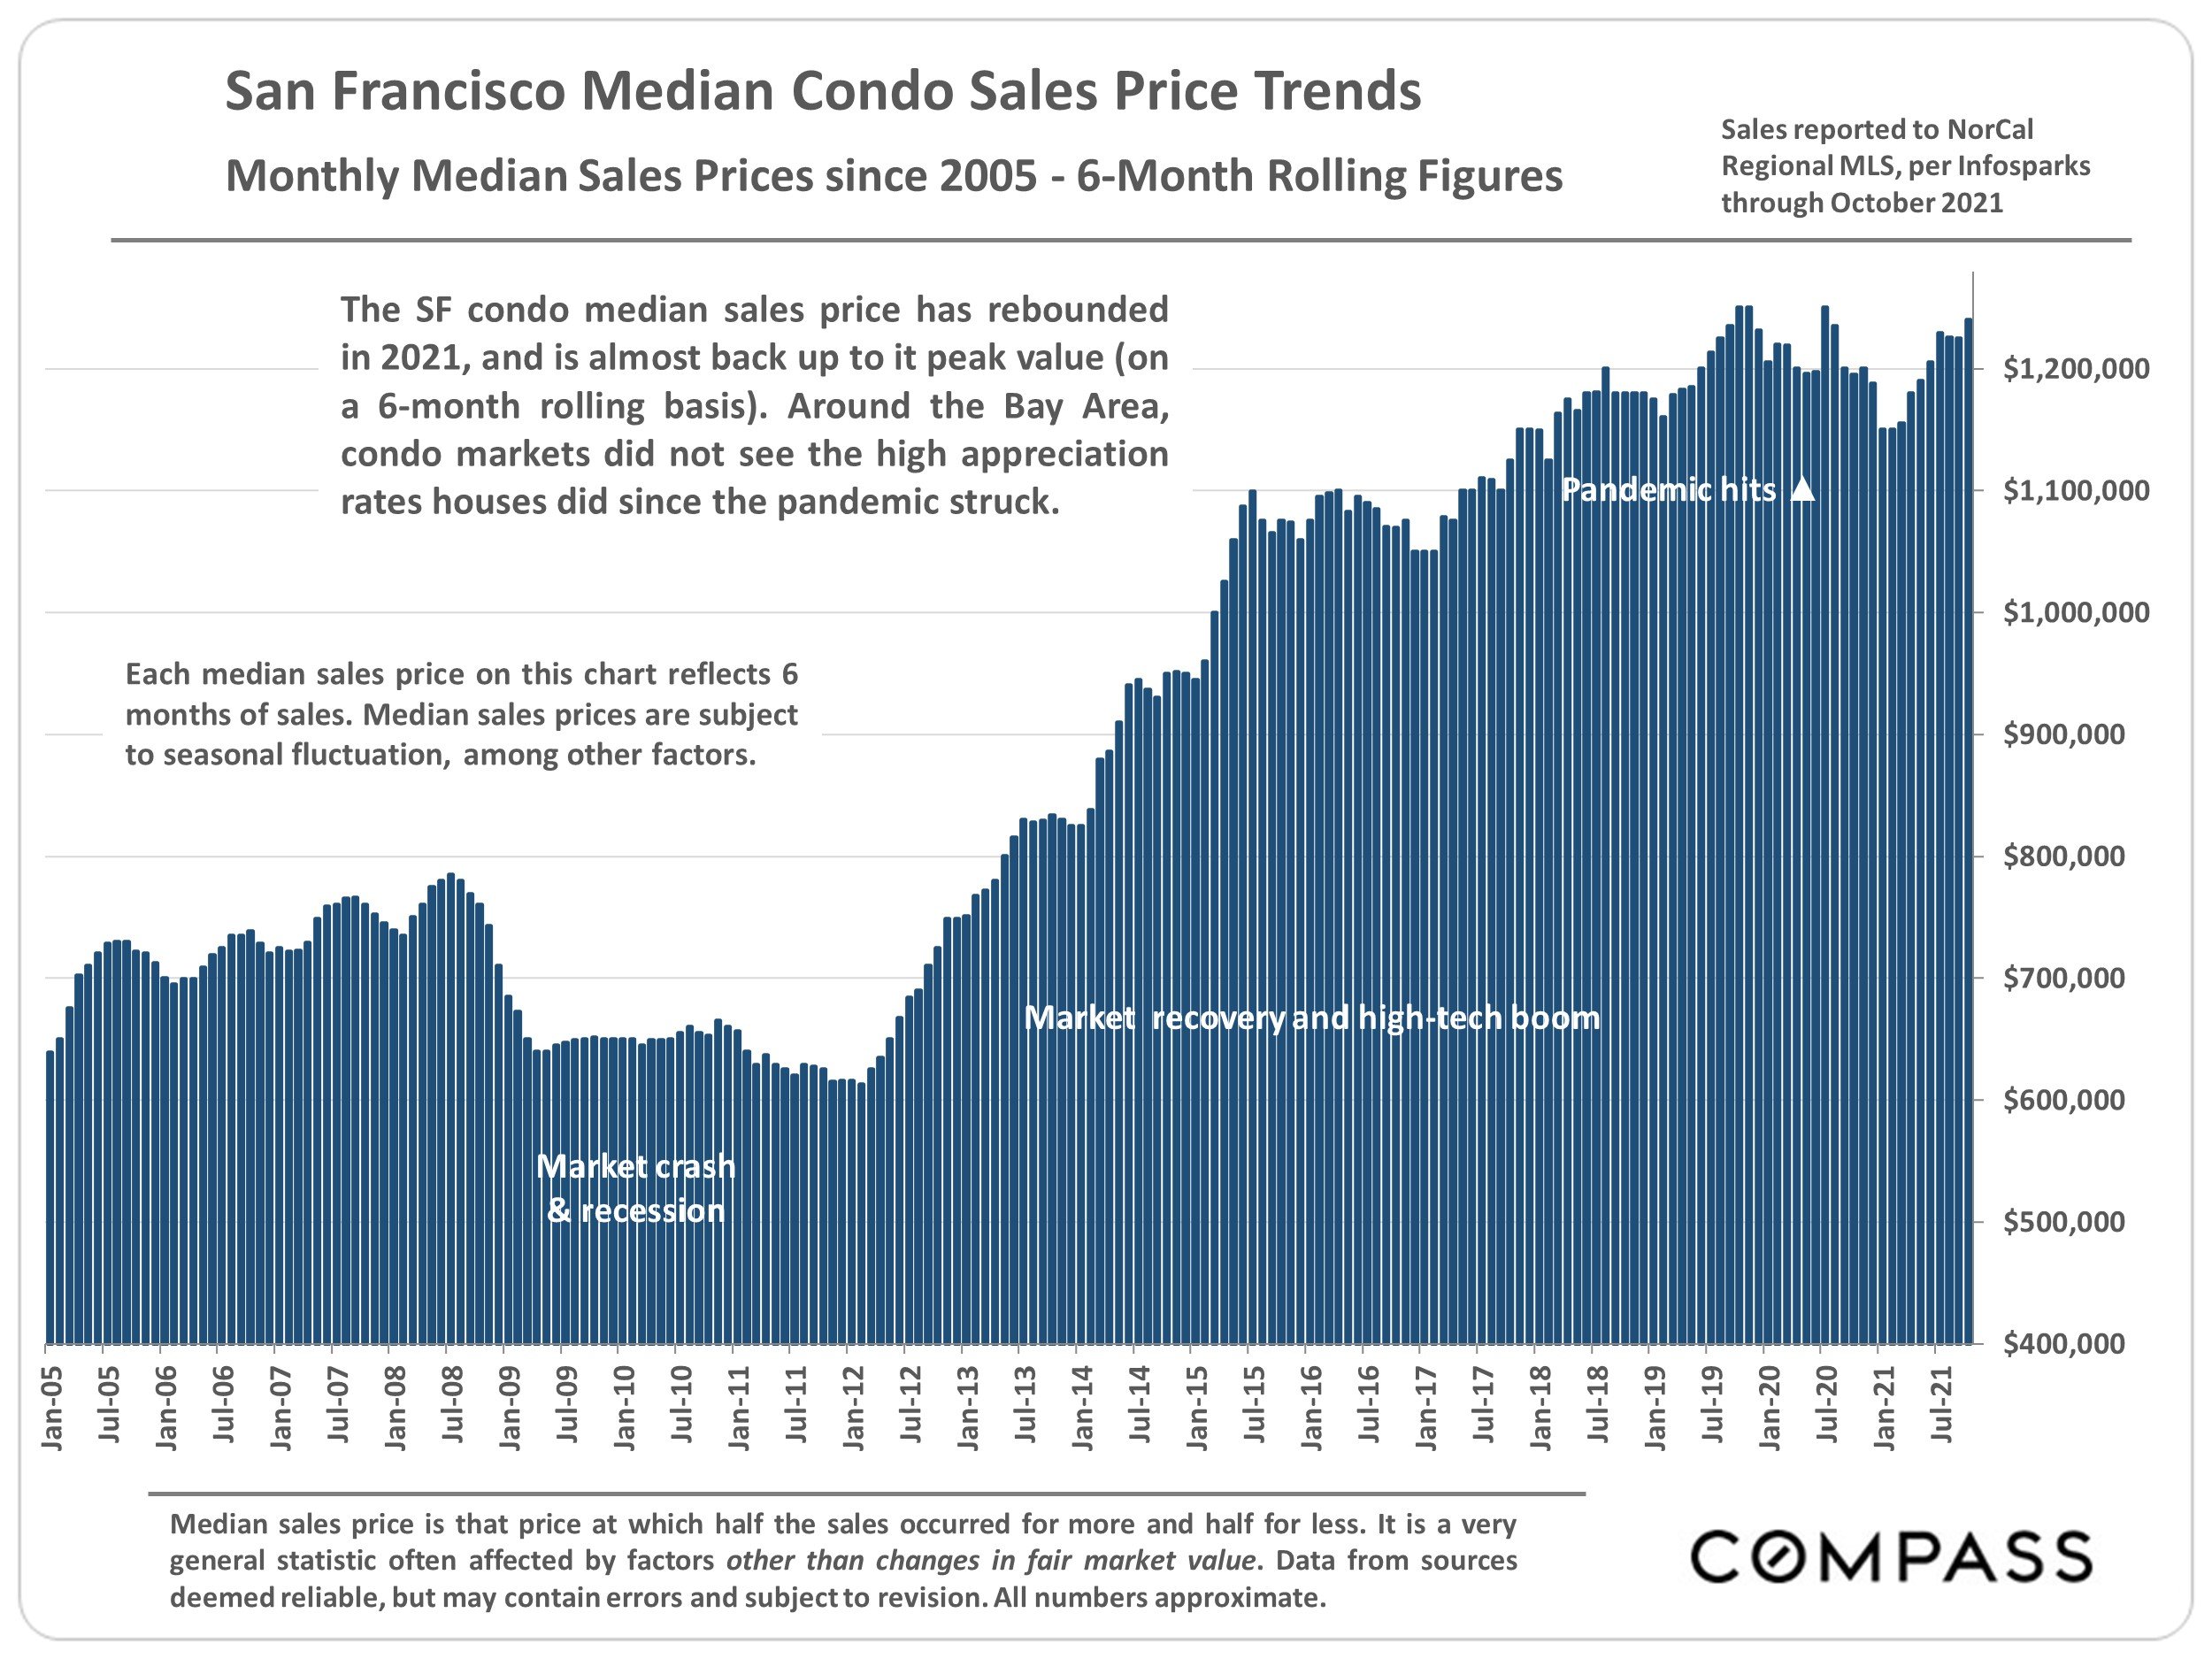
The SF condo median sales price has rebounded in 2021, and is almost back up to it peak value (on a 6-month rolling basis). Around the Bay Area, condo markets did not see the high appreciation rates houses did since the pandemic struck.
Each median sales price on this chart reflects 6 months of sales. Median sales prices are subject to seasonal fluctuation, among other factors.
What You Get for About $1,500,000 in San Francisco

A Sampling of August— October, 2021 Sales* Gradations in quality of location, condition & amenities are almost infinite: Sales may not represent current market values. Neighborhood Property Type Year Built Bedrooms & Baths Square Footage $/Sq.Ft. Excerpts from MLS Comments (sometimes edited) Ashbury Heights Condo Circa 1900 2/1.25 1144 $1333 "On charming 1-way street, lovely Victorian flat with period details throughout, 2 car parking" Central Sunset House 1927 2/1.5 1510 $980 "Wonderful home in excellent location in the Sunset, for investors or 1st time homebuyers" Excelsior House 1908 3/3 1800 $827 "Gorgeous, spacious, 2-level, 3-bedroom, 3-bathroom detached Excelsior home" Inner Mission Condo 1907 3/2 1260 $1206 "Urban chic, 3-bedroom, 2-bath classic Edwardian condo in heart of the Mission" Miraloma Park House 1948 2/1 1087 $1394 "2bd/lbath, split-level w/ outstanding panoramic deck views of SF, Bay, East Bay" Outer Parkside House 1947 3/2 1342 $1099 "Sweetest home in Sunset/Parkside; blocks from the ocean, immaculate turn-key beauty" Potrero Hill Condo 1992 2/2 1248 $1210 "Charming 2 bedroom, 2 bath condo on North slope of Potrero: in boutique 3 unit building" South Beach Condo 2014 1/1 830 $1831 "Beautifully appointed 1-bedroom atop Rincon Hill with unparalleled bay and city views" Sunnyside House Circa 1900 4/3 1969 $762 "2 homes on 1 lot: 3-BR, 2-bath w/views; separate, 1-BR + den, 1-bath cottage" Twin Peaks Condo 1962 2/2 1280 $1172 "Top floor unit, extensively renovated, unobstructed views, downtown to Mt. Diablo"
*Sales reported to NorCal Regional MLS, August through mid-October 2021, sales prices from $1,475,000 to $1,525,000. MLS listing comments sometimes edited. The devil is in the details: a brief description cannot do justice to any home. Data derived from sources deemed reliable, but may contain errors.
Median House Sales Price Trends
Selected San Francisco Neighborhoods, since 2012


2021 YTD median sales prices should be considered preliminary until substantiated over the longer term. Median sales prices can be affected by other market factors besides changes in fair market value and sometimes fluctuate without great meaningfulness.
Median Sales Price is that price at which half the sales occurred for more and half for less. Multiple neighborhood values through 2020 are averages of median sales prices. Data from sources deemed reliable, but may contain errors and subject to revision. All numbers are approximate and may change with late-reported sales.
San Francisco Market Dynamics & Seasonality
House, condo, TIC, co-op listings reported to NorCal Regional MLS, per Infosparks
New Listings Coming on Market by Month

New listing activity usually ebbs and flows by season: Climbing in spring, down in summer, spiking back up in September, and dropping way down in December. (In 2020, normal seasonality was upended by the pandemic.)
Home Sales Volume by Month since 2018

Listings Expired or Withdrawn (No Sale)

Listings typically expire or are withdrawn without selling due to being perceived as overpriced, and/or to avoid the slower markets of mid-late summer and, especially of the mid-winter holiday period. Many then relist at the beginning of the new, more active selling season, often at lower prices.
San Francisco Luxury Home Sales
3-Month Rolling Sales Figures, since 2018

The SF luxury home market is fiercely seasonal. After the autumn bump in sales, activity typically plunges to its low point in mid-winter. Typical seasonal trends were altered in 2020 by the pandemic.
San Francisco Market Supply vs. Demand
Months Supply of Inventory, January 2018 — Present

After shelter-in-place was implemented, the supply of homes for sale — as measured by months supply of inventory* — climbed, or in the case of condos, soared. But since December and through 2021 YTD, the supply and demand balance readjusted to reflect a much stronger market.
Months Supply of Inventory measures how long it would take to sell the existing inventory of listings for sale at the 12-month-average monthly rate of sale. Lower readings indicate stronger demand as compared to supply. Higher readings indicate higher supply as compared to demand.
Selected Macroeconomic Factors
The following slides look at trends in a number of important economic indicators — all of which can have significant impacts on financial and real estate markets. None of these charts imply predictions on future trends.
S&P 500 Stock Index
Long-Term Trends, 1985 — Autumn 2021

There has been a tremendous surge in household wealth generated by increases in financial market values. This has mostly benefited more affluent households.
Data from multpl.com and Yahoo! Finance. An approximate illustration only. Data from sources deemed reliable but may contain errors and subject to revision. Financial markets can be prone to significant volatility even on a short-term basis. For general illustration purposes only. All figures are approximate.
Inflation & Mortgage Interest Rates

Due to a variety of economic factors, the Consumer Price Index, a measurement of inflation, has jumped in 2021.
Historically, the standard remedy for surging inflation is to raise interest rates, but there are varying opinions as to whether higher inflation rates will persist, and what the exact response from the Federal Reserve Bank will be. Even if the Fed raises rates, the exact effect on mortgage rates is unclear. Predicting interest rate changes is extremely difficult.
Per Freddie Mac (FHLMC), on November 4, 2021, the weekly average, 30-year mortgage interest rate was 3.09%. (The 15-year rate was 2.35%.) The all-time 30-year-rate low of 2.65% was reached in January 2021. In November 2018, the rate was 4.94%; in 2007, 6.3%; in year 2000, 8%; and in 1990, 10% (the ast 3 not illustrated on this chart).
Interest rates may fluctuate suddenly and dramatically, and it is very difficult to accurately predict rate changes. Data from sources deemed reliable, but may contain errors and not guaranteed. Anyone interested in residential home loans should consult with a qualified mortgage professional and their accountant.
Household & Mortgage Debt Service as a Percentage of Disposable Income
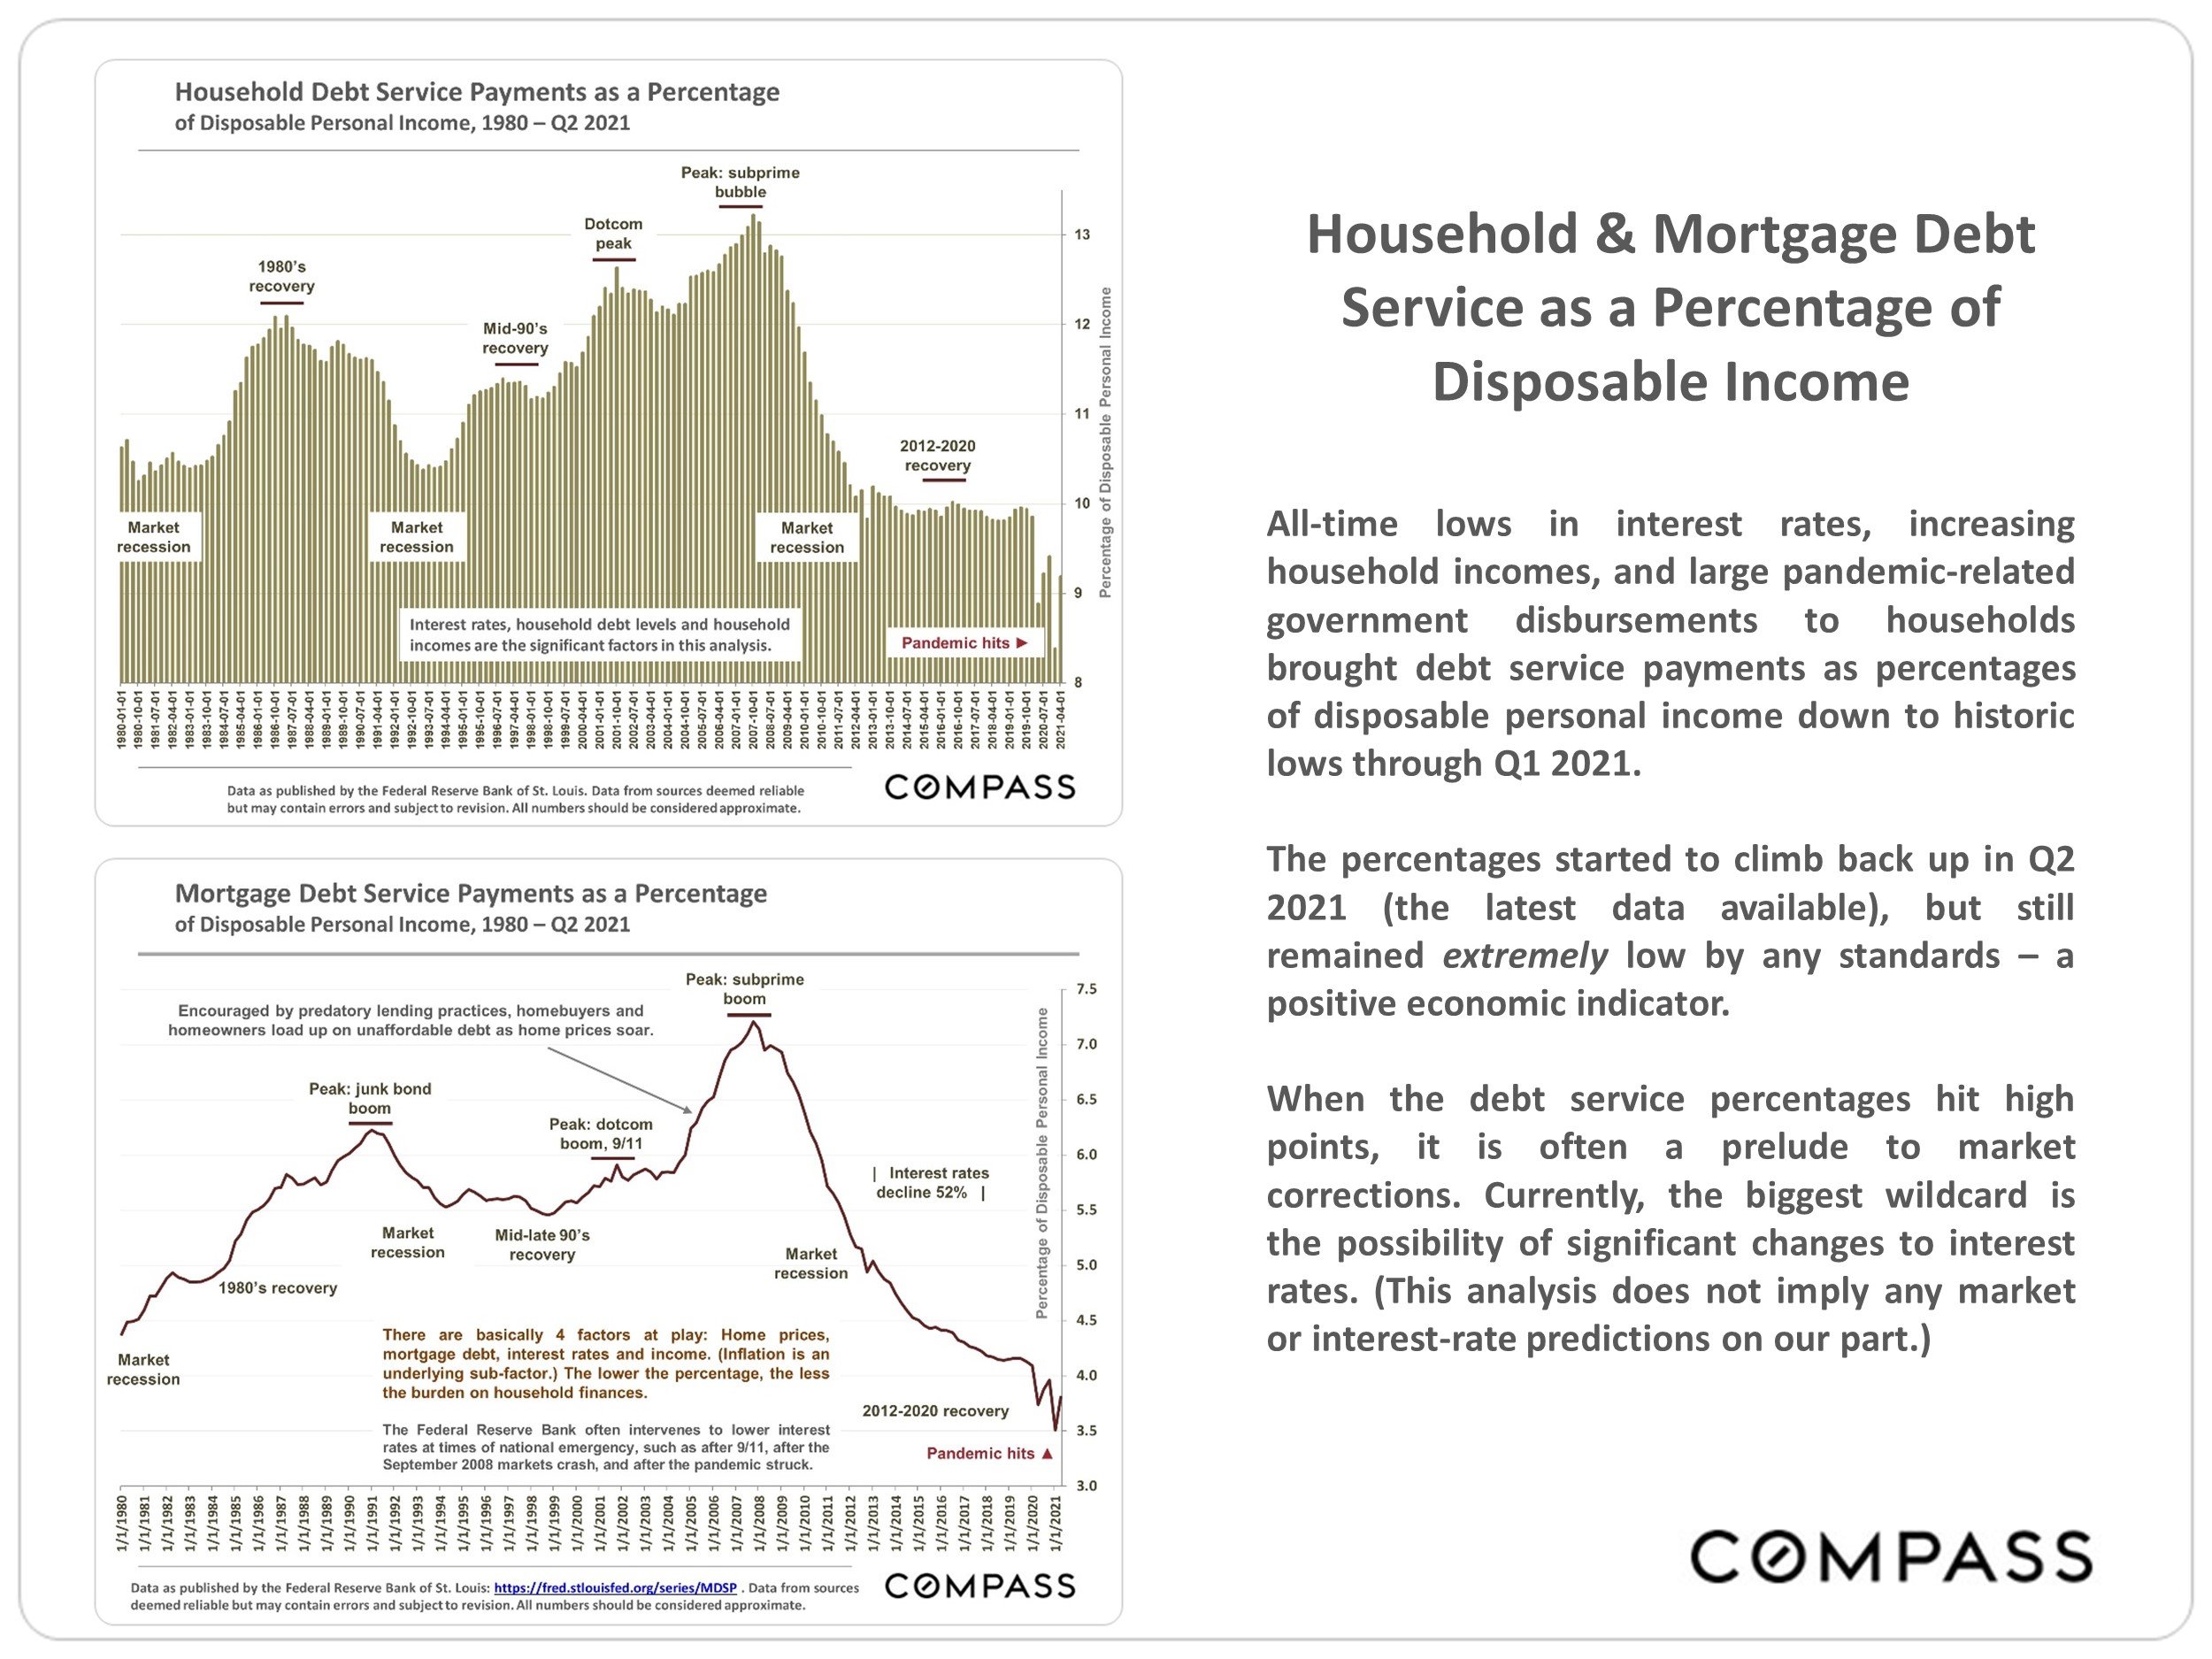
All-time lows in interest rates, increasing household incomes, and large pandemic-related
government disbursements to households brought debt service payments as percentages
of disposable personal income down to historic lows through Q1 2021.
The percentages started to climb back up in Q2 2021 (the latest data available), but still remained extremely low by any standards — a positive economic indicator.
When the debt service percentages hit high points, it is often a prelude to market corrections. Currently, the biggest wildcard is the possibility of significant changes to interest rates. (This analysis does not imply any market or interest-rate predictions on our part.)
Data as published by the Federal Reserve Rank of St. Louis: httos://fred.sdouisfed.oraiseriesAIDSP . Data from sources deemed reliable but may contain errors and revision. All numbers should be considered approximate.
Consumer Sentiment (Confidence) Index
University of Michigan, January 2006 — September 2021
As published by the Federal Reserve Bank of St. Louis; adjusted to 2-month-rolling average

Statistics are generalities, essentially summaries of widely disparate data generated by dozens, hundreds or thousands of unique, individual sales occurring within different time periods. They are best seen not as precise measurements, but as broad, comparative indicators, with reasonable margins of error. Anomalous fluctuations in statistics are not uncommon, especially in smaller, expensive market segments. Last period data should be considered estimates that may change with late-reported data. Different analytics programs sometimes define statistics — such as "active listings," "days on market," and "months supply of inventory" — differently: what is most meaningful are not specific calculations but the trends they illustrate. Most listing and sales data derives from the local or regional multi-listing service (MLS) of the area specified in the analysis, but not all listings or sales are reported to MLS and these won't be reflected in the data. "Homes" signifies real-property, single-household housing units: houses, condos, co-ops, townhouses, duets and TICs (but not mobile homes), as applicable to each market.
City/town names refer specifically to the named cities and towns, unless otherwise delineated. Multi-county metro areas will be specified as such. Data from sources deemed reliable, but may contain errors and subject to revision. All numbers to be considered approximate.
Many aspects of value cannot be adequately reflected in median and average statistics: curb appeal, age, condition, amenities, views, lot size, quality of outdoor space, "bonus" rooms, additional parking, quality of location within the neighborhood, and so on. How any of these statistics apply to any particular home is unknown without a specific comparative market analysis.
Median Sales Price is that price at which half the properties sold for more and half for less. It may be affected by seasonality, "unusual" events, or changes in inventory and buying trends, as well as by changes in fair market value. The median sales price for an area will often conceal an enormous variety of sales prices in the underlying individual sales.
Dollar per Square Foot is based upon the home's interior living space and does not include garages, unfinished attics and basements, rooms built without permit, patios, decks or yards (though all those can add value to a home). These figures are usually derived from appraisals or tax records, but are sometimes unreliable (especially for older homes) or unreported altogether. The calculation can only be made on those home sales that reported square footage.
Compass is a real estate broker licensed by the State of California, DRE 01527235. Equal Housing Opportunity. This report has been prepared solely for information purposes. The information herein is based on or derived from information generally available to the public and/or from sources believed to be reliable. No representation or warranty can be given with respect to the accuracy or completeness of the information. Compass disclaims any and all liability relating to this report, including without limitation any express or implied representations or warranties for statements contained in, and omissions from, the report. Nothing contained herein is intended to be or should be read as any regulatory, legal, tax, accounting or other advice and Compass does not provide such advice. All opinions are subject to change without notice. Compass makes no representation regarding the accuracy of any statements regarding any references to the laws, statutes or regulations of any state are those of the author(s). Past performance is no guarantee of future results.