May 2022 Market Report

722 Steiner, the original of the Painted Ladies, on the far left, sold on April 1 for $6,000,000.
In April 2022, the Bay Area continued to see appreciation, overbidding and days-on-market reflecting extremely intense demand. But sales are a lagging indicator reflecting offers accepted 3-6 weeks earlier. April sales mostly reflect buyers who locked in mortgage rates before the big late-March/April jumps, buyers highly motivated to buy before their interest rate locks expired, adding short-term pressure to demand.
Declining interest rates stimulate demand: In recent years, large rate declines subsidized much of the surge in home prices. Escalating interest rates initially fueled demand in early 2022 as buyers rushed to avoid further rises, but at a certain point, big increases, especially if coupled with peak prices, batter affordability. And all buyers – even all-cash buyers – can be affected financially and psychologically by stock market declines and economic uncertainty. If continuing, these factors can be expected to dampen purchase activity.
As of May 5, mortgage rates were up 69% in 2022, and the scale and speed of the increase make it difficult to predict precise effects; inflation is at a 40-year high; the S&P 500 is down 14% and the Nasdaq, 22%. (Markets have been volatile: Interest rates and stock markets are subject to sudden, dramatic changes.) The housing market is beginning to show preliminary, but not universal reactions. Accounts of less crowded open houses and fewer offers on new listings are becoming more common. Some buyers are dropping out or becoming more selective; some sellers are moving listing dates forward. In many markets, declines in listings going into contract occurred in April. But some agents report no change, so far, in client plans or motivation. Due to the time involved in the home search/closing process, and the extremely heated conditions of early 2022, substantial changes in closed-sales statistics, if coming, won’t appear until later in Q2 or Q3.
Even the hottest markets eventually cool. This does not necessarily imply a large “bubble and crash” (terms much overused). Over the past 4 decades, a cooling shift has typically meant a gradual decline in sales activity, then either a leveling off in appreciation or price declines of 5% to 10%: More like a slow leak in an over-pressurized tire than a blowout at high speed. The 2008 subprime crisis – a true bubble & crash – was an extreme event brought about by a massive failure of ethics, underwriting standards and risk management in the loan, banking, investment and ratings industries.
When hot markets shift cooler, effects are typically first reflected in reductions in multiple offers, overbidding and the number of homes going into contract; gradual increases in active listings and time-on-market; and gradual declines in year-over-year appreciation rates. Historically, after a down cycle runs its course, the market moves into the next upcycle and home prices climb (often relatively quickly) above previous peaks. Over the longer term, past appreciation trends – magnified by tax breaks & financing options – have typically made Bay Area real estate an excellent, and often spectacular investment.
Looking back to spring 2018, 6 years into the market recovery from the foreclosure crisis, after an enormous boom in high-tech hiring, immigration and wealth, and dramatic home-price appreciation, Bay Area markets generally hit an intense peak in demand. In the second half of 2018, interest rates climbed 31% over the 2017 low, the S&P 500 dropped almost 20%, and supply and demand indicators cooled. By spring 2019, Bay Area median house sales prices were typically either flat (in SF, supported by the early 2019 IPO frenzy) or down 2% - 7%: Not a huge change, but after the high appreciation rates of previous years, a distinct shift in the psychology of the market. In Q3 2019, the Fed began lowering interest rates again. The pandemic struck in spring 2020, with profound social/economic effects, interest rates plunged, stock markets soared, and house prices rapidly climbed far above 2018 peaks. (Condo markets saw different pandemic-era dynamics.)
Many economic, political and demographic factors affect housing markets. What occurs with inflation, interest rates and stock markets will certainly be important. How the media covers the market will influence buyer and seller psychology. And major events often arise from off the radar (e.g. the pandemic, the war in Ukraine). The speed and scale of market changes often vary by region, price segment and property type. Less expensive homes may be more affected initially by rising interest rates: In SF, it appears the condo market might be seeing the first shifts in softening demand. Buyers of more expensive homes tend to be more influenced by sustained changes in financial markets. (These are generalities.)
As always, analysts, economists and industry commentators are making diverging forecasts. Sales data in coming months should soon provide more concrete indications of market direction. This is not intended to convince anyone to take a specific course of action, or to predict the future, but only to provide, to the best of our ability, a straightforward analysis of market conditions and trends.
San Francisco Home Price Appreciation
Monthly Median House Sales Prices, 6-Month Rolling Average, since 1990

6-month rolling average of the monthly median sales prices for “existing” houses since 1990, per CA Association of Realtors® or NorCal Regional MLS data. Analysis may contain errors and subject to revision. All numbers are approximate. Last month figure estimated from data available early in following month.
Median sales price is that price at which half the sales occurred for more and half for less. It is a very general statistic often affected by factors other than changes in fair market value. Seasonal fluctuations are common.
In April 2022, the 3-month rolling median house sales price was up approximately 15% from April 2021, and up 25% from April 2020. (This chart is 6-month rolling to smooth long-term trend lines.)
San Francisco Median Condo Sales Price Trends
Monthly Median Sales Prices since 2005 - 6-Month Rolling Figures

Median sales price is that price at which half the sales occurred for more and half for less. It is a very general statistic often affected by factors other than changes in fair market value. Data from sources deemed reliable, but may contain errors and subject to revision. All numbers approximate. Sales reported to NorCal MLS Alliance, per Infosparks through April 2022. Each median sales price on this chart reflects 6 months of sales. Median sales prices are subject to seasonal fluctuation, among other factors.
In April 2022, the 3-month rolling median condo sales price was up approximately 7.5% from April 2021, and up 3% from April 2020. (This chart is 6-month rolling to smooth long-term trend lines.)
Around the Bay Area, condo markets typically did not see the high appreciation rates houses did since the pandemic struck.
Mortgage Interest Rate Trends, 2016 – Present
30-Year Conforming Fixed-Rate Loans, Weekly Average Readings

Interest rates may fluctuate suddenly and dramatically, and it is very difficult to predict rate changes. Data from sources deemed reliable but not guaranteed. Anyone interested in residential home loans should consult with a qualified mortgage professional and their accountant. Rates published by the FHLMC (Freddie Mac).
Per Freddie Mac (FHLMC), on May 5, 2022, the weekly, average, 30-year interest rate was 5.27%, up 69% from 3.11% on 12/30/21, and the highest rate since 2011. The historic low of 2.65% occurred in January 2021. In November 2018, the rate was 4.94%.
Increased mortgage rates are not necessarily a bad thing for buyers. Read more about why it could be a good time to buy in a volatile market.
Bay Area Housing Costs – A Sample Illustration
2018-2022, Median House Sales Price & Monthly Principal/Interest Payment

Median sales prices for “existing single family dwellings” in March of each year for 9-county Bay Area, per CA Association of Realtors. Approx. 30-year fixed interest rates per FHLMC, at end of April of each year. Approx. monthly principal and interest payments per Bankrate.com. 20% downpayments would increase proportionally to sales prices. Data from sources deemed reliable, but may contain errors and subject to revision. All numbers are approximate.
Median Bay Area house sales price in March of each year. Monthly principal and interest payments, based on 80% loan at the prevailing, 30-year fixed, conforming loan rate. This is a sample illustration only: Bay Area Q1 2022 median house sales prices ranged from $475,000 to$10 million, and appreciation rates varied by community, price segment and property type.
San Francisco Homes Market
Active & Coming-Soon Listings on 1st of Month*

Active/Coming-Soon listings posted to NorCal MLS Alliance vs. 12 months sales of MLS home listings through 2/28/22. Data from sources deemed reliable, but may contain errors and subject to revision. Not all listings are posted to MLS. All numbers approximate. The number of active listings constantly changes.
As of May 1, 2022, the number of active/coming-soon listings posted to MLS equaled a 9 week supply of inventory as compared to 12 months sales. Generally speaking, under 3 months of inventory is typically considered a “seller’s market.”
Of the active/coming-soon listings on May 1st, 78% were condos, co-ops, TICs and townhouses, & 22% houses.
The # of active listings on a given day is affected by 1) the # of new listings coming on market, 2) how quickly buyers put them into contract, and 3) the sustained heat of the market over time.
Avg. Sales Price to Original List Price Percentage (SP/OP %)
San Francisco Market Dynamics since 2018: Overbidding

Residential market activity reported to NORCAL MLS® ALLIANCE, per Infosparks. Data from sources deemed reliable, but may contain errors and subject to revision. All numbers are approximate, and may change with late-reported sales.
115% signifies an average sales price 15% above original list price. Sales in one month, to a large degree, reflect accepted offer activity in the previous month.
Average Days on Market
San Francisco: Time on Market to Accepted Offer

As reported to NorCal MLS Alliance. Data from sources deemed reliable, but they may contain errors and subject to revision. All numbers approximate. Sales in one month, to a large degree, reflect accepted offer activity in the previous month. Sales reported to NorCal MLS Alliance, per Infosparks.
Days-on-market is an indicator of how quickly buyers are snapping up listings, and typically rises and falls according to seasonal trends. Houses (blue line) generally sell faster than condos (green line), but both are trending very low.
Listings Accepting Offers (Going into Contract)
San Francisco Market Dynamics by Month
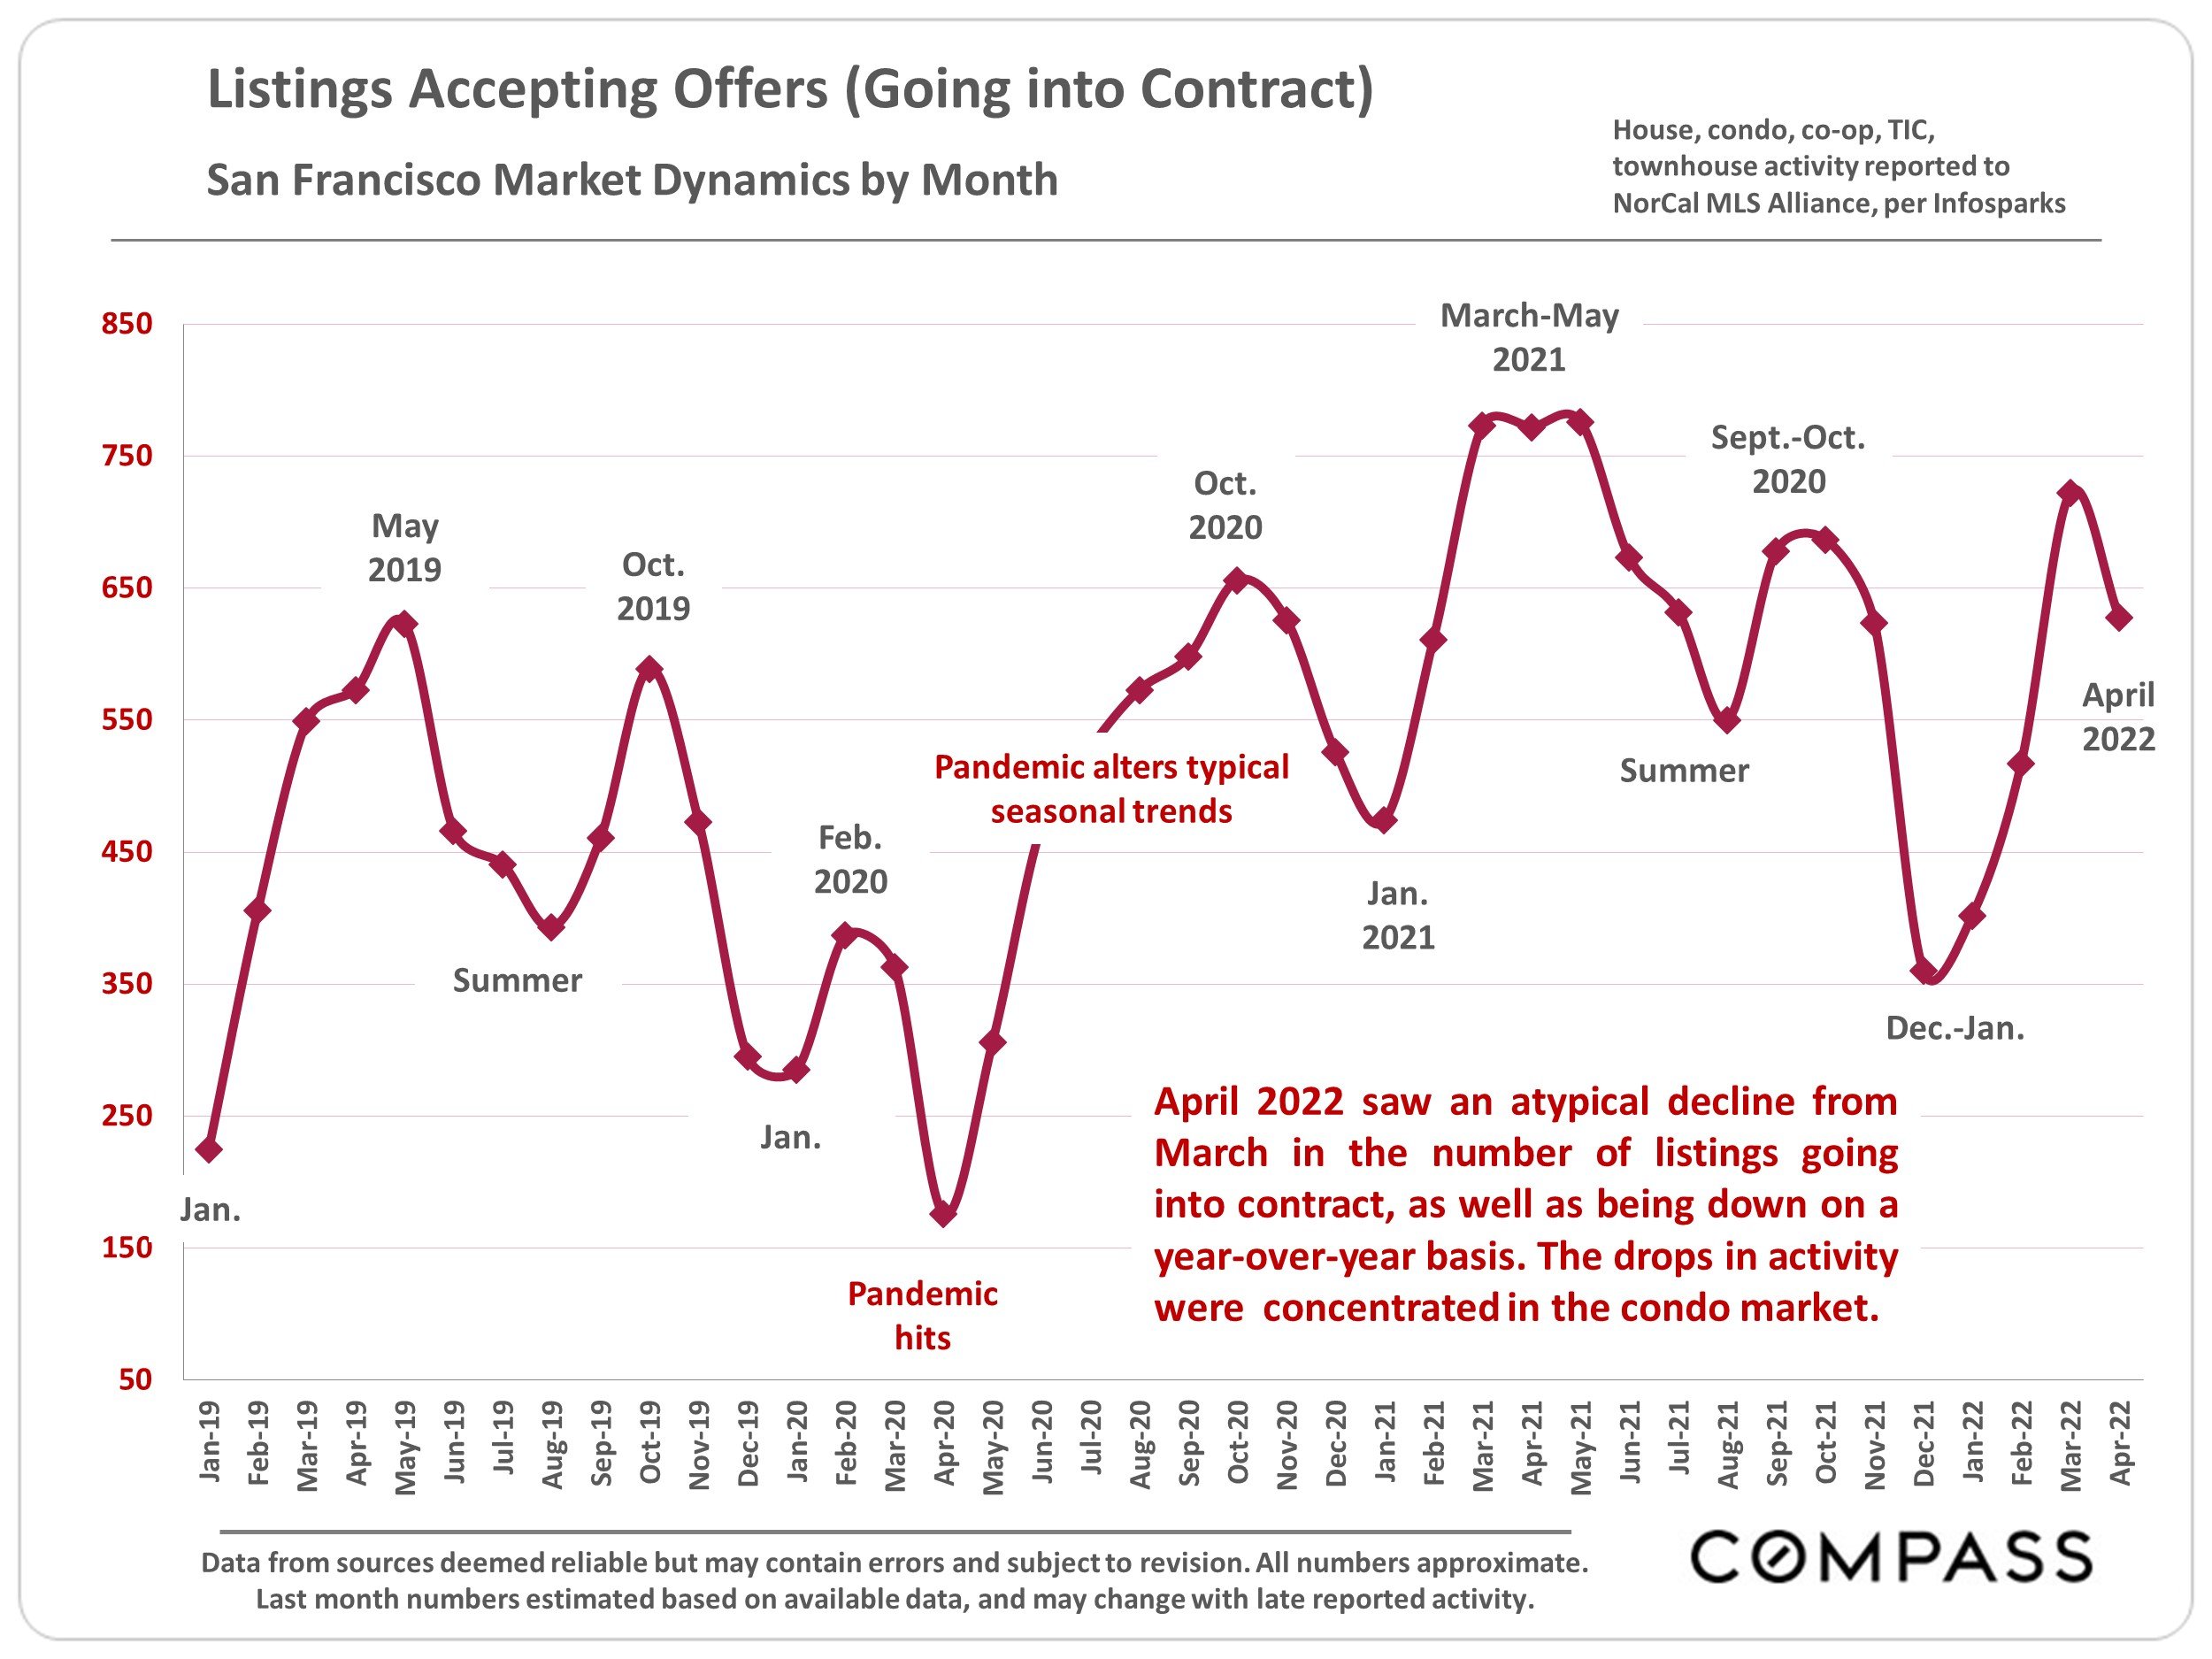
Data from sources deemed reliable but may contain errors and subject to revision. All numbers approximate. Last month numbers estimated based on available data, and may change with late reported activity.
April 2022 saw an atypical decline from March in the number of listings going into contract, as well as being down on a year-over-year basis. The drops in activity were concentrated in the condo market.
Home Sales Volume by Month since 2018
San Francisco Market Dynamics & Seasonality

Activity reported to NorCal Regional MLS, per Infosparks. Data from sources deemed reliable but may contain errors and subject to revision. All numbers are approximate. Last month numbers estimated based on available data. House, condo, TIC, co-op sales reported to NorCal Regional MLS, per Infosparks.
As illustrated, sales volume usually ebbs and flows by season: Up in spring, down in summer, back up in fall, and way down in mid-winter.
Sales in one month mostly reflect accepted-offer activity in the previous month. April 2022 sales were well down from April 2021, but above April 2019. (2020 figures were deeply impacted by the pandemic hitting).
San Francisco Higher-Price House Sales Volume
Houses Selling at $3 Million+, since 2018

Sales reported to Norcal MLS Alliance, per Infosparks. Data from sources deemed reliable but may contain errors and subject to revision. All numbers approximate, and may change with late-reported sales.
The number of higher-price house sales typically ebbs and flows by season, usually peaking in spring or sometimes fall. Sales usually follow the time of offers being accepted by 3 to 5 weeks.
San Francisco Luxury Condo, Co-op, Townhouse, TIC Sales
Units Selling for $2 Million+, since 2018

Does not include sales unreported to MLS: Not all sales are reported. Data from sources deemed reliable but may contain errors and subject to revision. All numbers approximate, and may change with late-reported activity.
The number of sales typically ebbs and flows by season. Sales usually follow the time of offers being accepted by 3 to 5 weeks.
San Francisco Market Supply vs. Demand
Months Supply of Inventory, January 2018 – Present

NorCal MLS Alliance data per Infosparks. Last reading may change with late reported activity. Does not include new-project condo activity unreported to MLS. Data from sources deemed reliable, but may contain errors and subject to revision. All numbers approximate. Late reported data may change latest months’ numbers.
Months Supply of Inventory (MSI) measures how long it would take to sell the existing inventory of listings for sale at the 12-month-average monthly rate of sale. Lower readings indicate stronger demand as compared to supply. Lower readings indicate lower supply as compared to demand.
National Housing Market Reports
Being the center of high-tech industry and other unique local factors have certainly had deep effects on Bay Area real estate markets, but over the past 20 years, the differences between local and national trends have generally been more of degree than direction: General economic conditions and market ups and downs run on similar tracks – which makes it useful to look at national data indicators as well.
“National housing market indicators available as of April showed activity in housing markets slowed overall... Sales of existing homes declined to the slowest pace since June 2020... The inventory of homes for sale rose [month over month, and year-over-year].” U.S. Department of Housing and Urban Development, Housing Market Indicators Monthly Update for April 2022, published May 5, 2022
“[In March 2022] All regions [of the country] reported decreases in year-over-year contract activity. Sales were down across each region year-over-year.” National Association of Realtors, April 27, 2022
“On the seller side, the number of new listings grew this week and there’s some evidence that the number of potential buyers is shrinking as high costs derail some buying plans. As new listings grow and home sales slow... we expect active inventory to surpass year ago levels in the next few months. [As] home sales lose momentum, price growth is likely to follow suit.” Realtor.com National Report, May 2, 2022
“The combination of swift home price growth and the fastest mortgage rate increase in over forty years is finally affecting purchase demand. Homebuyers... are coping in a variety of ways, including switching to adjustable-rate mortgages... We expect the decline in demand to soften home price growth... later this year.” Freddie Mac (FHLMC), April 28, 2022
“With mortgage rates increasing... [loan] applications continued to decline... to the lowest level since 2018.” Mortgage Bankers Association, April 27, 2022
Consumer Price Index
12-Month Percentage Change, since 1980
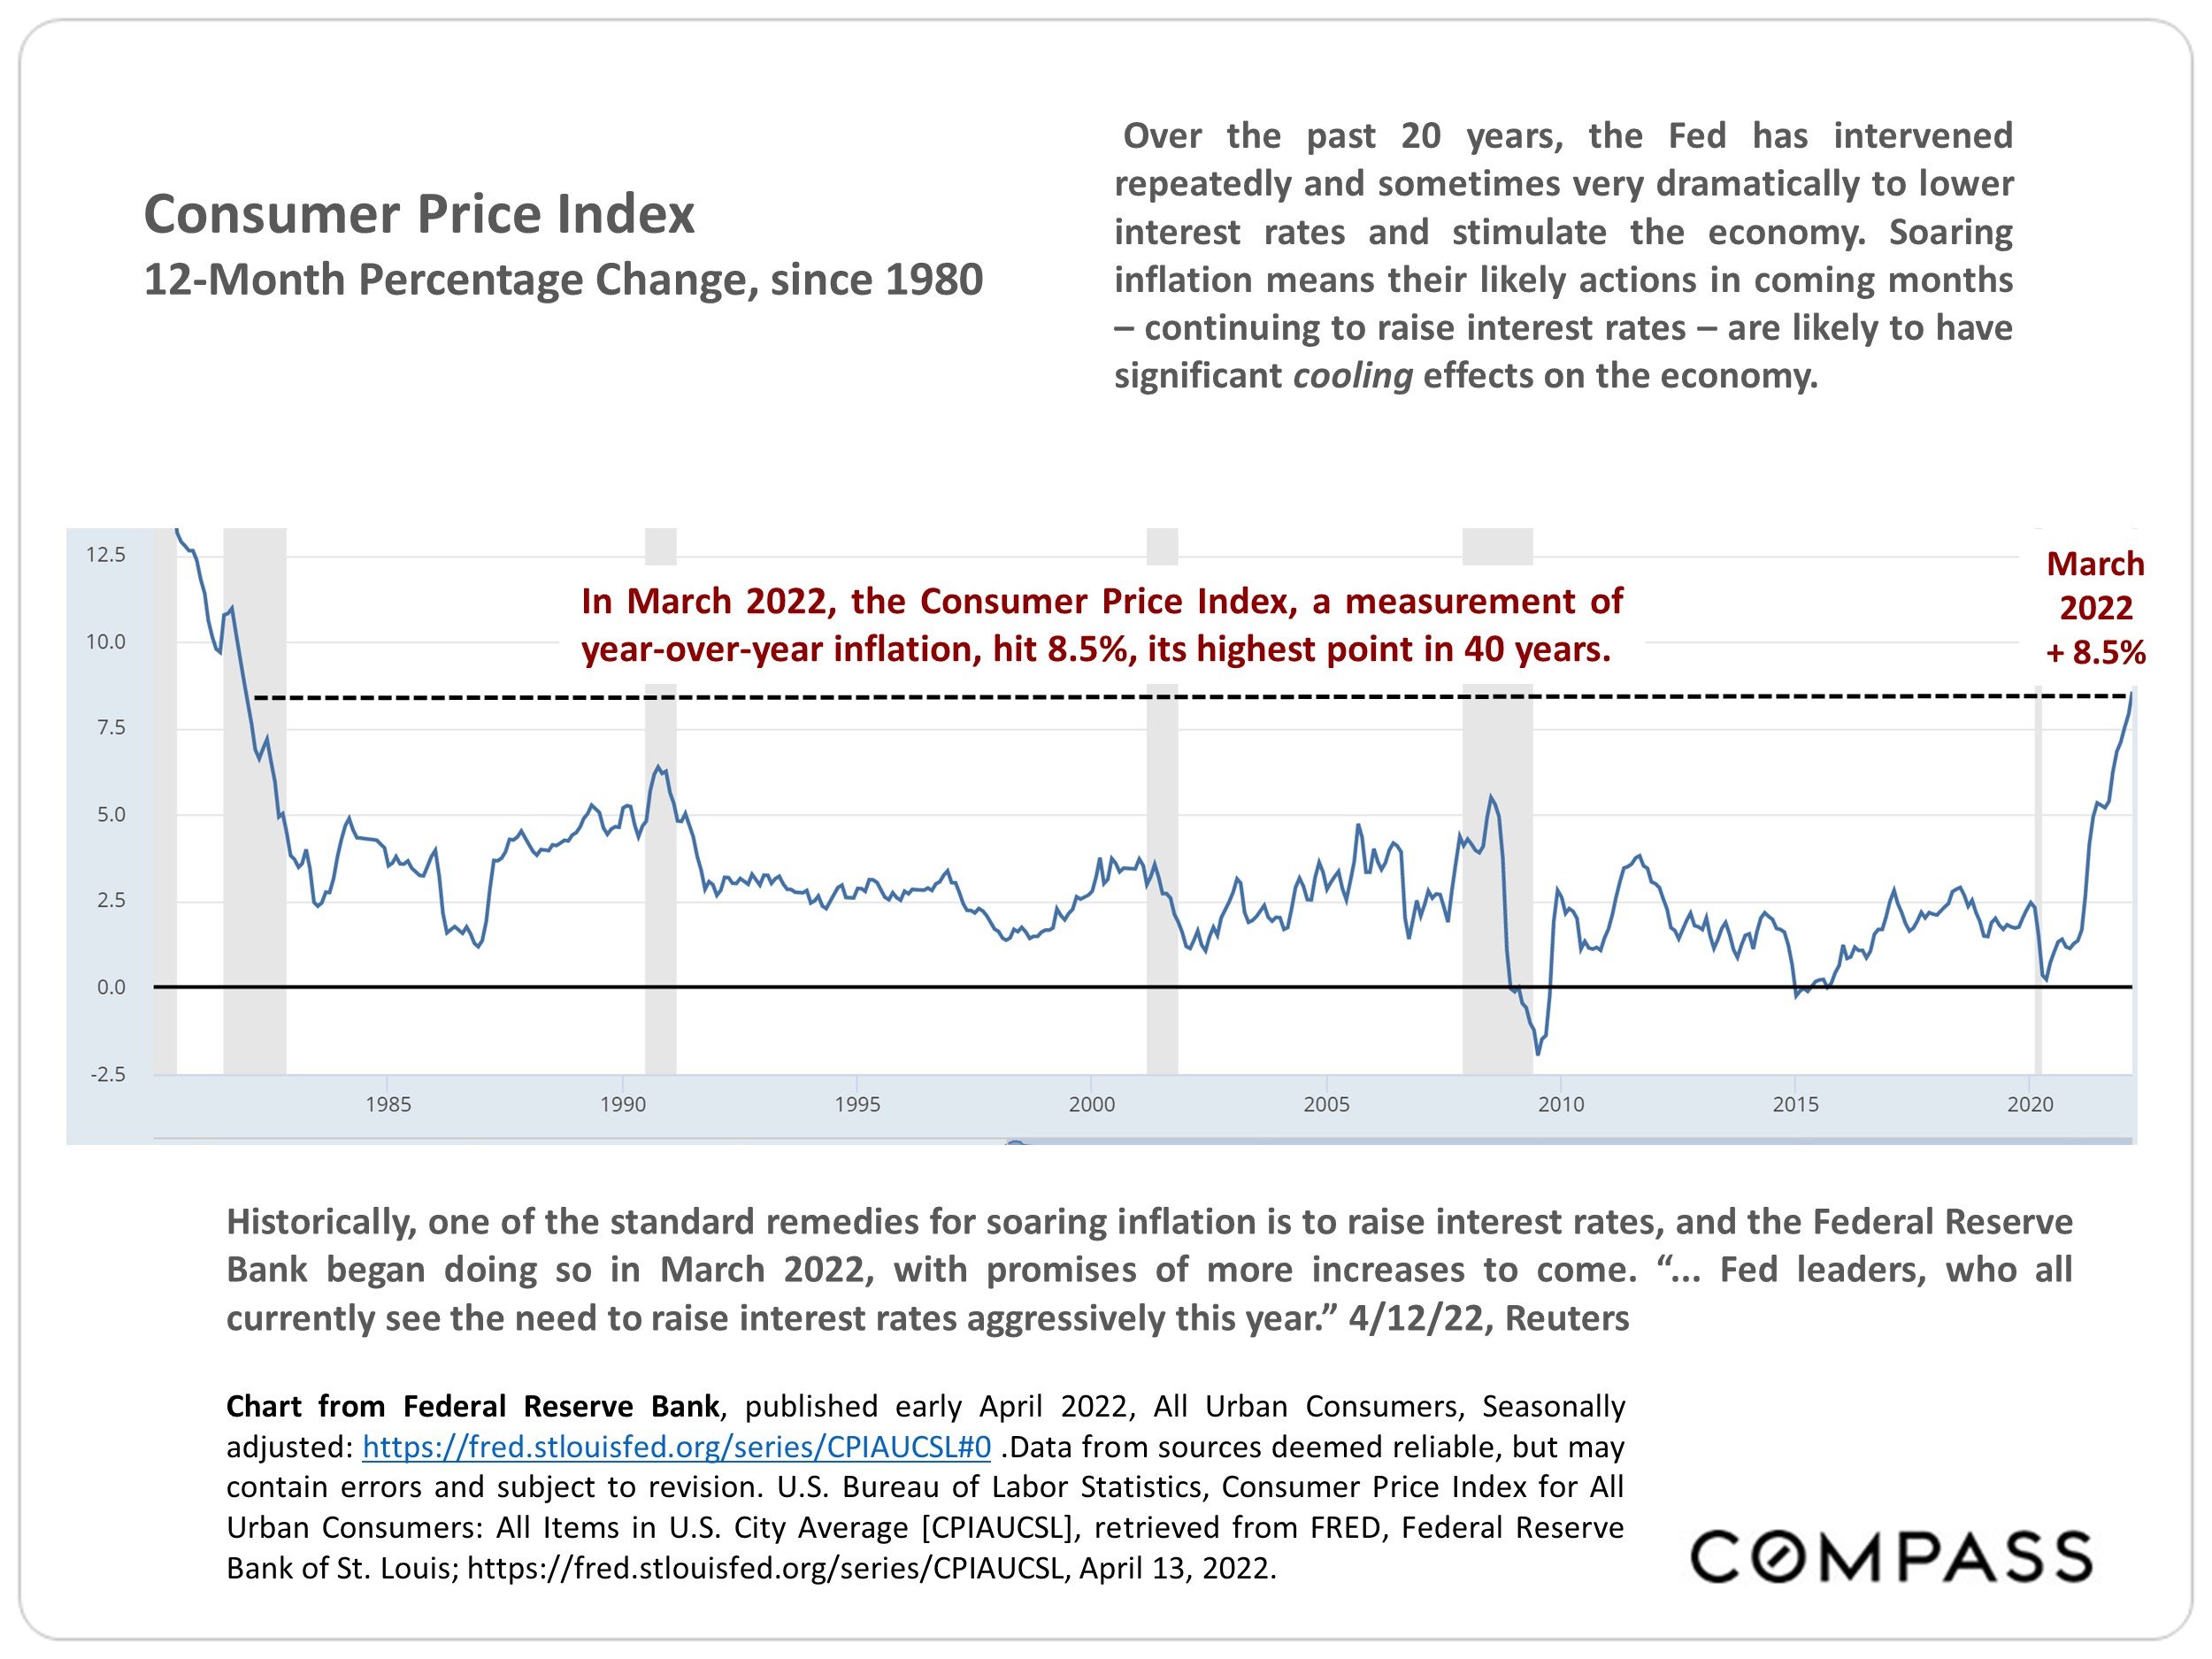
Chart from Federal Reserve Bank, published early April 2022, All Urban Consumers, Seasonally adjusted: https://fred.stlouisfed.org/series/CPIAUCSL#0 .Data from sources deemed reliable, but may contain errors and subject to revision. U.S. Bureau of Labor Statistics, Consumer Price Index for All Urban Consumers: All Items in U.S. City Average [CPIAUCSL], retrieved from FRED, Federal Reserve Bank of St. Louis; https://fred.stlouisfed.org/series/CPIAUCSL, April 13, 2022.
In March 2022, the Consumer Price Index, a measurement of year-over-year inflation, hit 8.5%, its highest point in 40 years.
Over the past 20 years, the Fed has intervened repeatedly and sometimes very dramatically to lower interest rates and stimulate the economy. Soaring inflation means their likely actions in coming months – continuing to raise interest rates – are likely to have significant cooling effects on the economy.
Historically, one of the standard remedies for soaring inflation is to raise interest rates, and the Federal Reserve Bank began doing so in March 2022, with promises of more increases to come. “... Fed leaders, who all currently see the need to raise interest rates aggressively this year.” 4/12/22, Reuters
Average Annual Interest Rates since 1981
30-Year Conforming Fixed-Rate Loans, by Year, plus Latest Weekly Reading

Interest rates may fluctuate suddenly and dramatically. Data from sources deemed reliable but not guaranteed. Anyone interested in residential home loans should consult with a qualified mortgage professional and accountant.
Annual average interest rates, plus historic low hit in January 2021, the 12/30/21 reading, and latest weekly reading, as published by the FHLMC (Freddie Mac). As you can see, rates are rising from their historic lows, but are still broadly lower than they were prior to 2009.
Statistics are generalities, essentially summaries of widely disparate data generated by dozens, hundreds or thousands of unique, individual sales occurring within different time periods. They are best seen not as precise measurements, but as broad, comparative indicators, with reasonable margins of error. Anomalous fluctuations in statistics are not uncommon, especially in smaller, expensive market segments. Last period data should be considered estimates that may change with late-reported data. Different analytics programs sometimes define statistics – such as “active listings,” “days on market,” and “months supply of inventory” – differently: what is most meaningful are not specific calculations but the trends they illustrate. Most listing and sales data derives from the local or regional multi-listing service (MLS) of the area specified in the analysis, but not all listings or sales are reported to MLS and these won’t be reflected in the data. “Homes” signifies real-property, single-household housing units: houses, condos, co-ops, townhouses, duets and TICs (but not mobile homes), as applicable to each market. City/town names refer specifically to the named cities and towns, unless otherwise delineated. Multi-county metro areas will be specified as such. Data from sources deemed reliable, but may contain errors and subject to revision. All numbers to be considered approximate.
Many aspects of value cannot be adequately reflected in median and average statistics: curb appeal, age, condition, amenities, views, lot size, quality of outdoor space, “bonus” rooms, additional parking, quality of location within the neighborhood, and so on. How any of these statistics apply to any particular home is unknown without a specific comparative market analysis.
Median Sales Price is that price at which half the properties sold for more and half for less. It may be affected by seasonality, “unusual” events, or changes in inventory and buying trends, as well as by changes in fair market value. The median sales price for an area will often conceal an enormous variety of sales prices in the underlying individual sales.
Dollar per Square Foot is based upon the home’s interior living space and does not include garages, unfinished attics and basements, rooms built without permit, patios, decks or yards (though all those can add value to a home). These figures are usually derived from appraisals or tax records, but are sometimes unreliable (especially for older homes) or unreported altogether. The calculation can only be made on those home sales that reported square footage.
Compass is a real estate broker licensed by the State of California, DRE 01527235. Equal Housing Opportunity. This report has been prepared solely for information purposes. The information herein is based on or derived from information generally available to the public and/or from sources believed to be reliable. No representation or warranty can be given with respect to the accuracy or completeness of the information. Compass disclaims any and all liability relating to this report, including without limitation any express or implied representations or warranties for statements contained in, and omissions from, the report. Nothing contained herein is intended to be or should be read as any regulatory, legal, tax, accounting or other advice and Compass does not provide such advice. All opinions are subject to change without notice. Compass makes no representation regarding the accuracy of any statements regarding any references to the laws, statutes or regulations of any state are those of the author(s). Past performance is no guarantee of future results.