March 2022 Market Report

Photo by GPA Photo Archive on Flickr via Creative Commons license
So far in 2022, Bay Area real estate markets appear largely unfazed by higher interest rates, volatility in financial markets, and troubling international events. The prevailing dynamic remains one of strong buyer demand competing for an inadequate inventory of listings for sale: Crowded open houses, multiple offers, fierce overbidding, and fast sales remain common. That is not to say there haven’t been buyers negatively impacted by higher loan rates and/or recent declines in stock portfolios; and some buyers and sellers have become more hesitant or paused their plans, awaiting more clarity amid recent developments. But not enough to move the needle on the fundamentally high-demand/low-supply conditions which dominated 2021.
As typical at the start of the year, the number of new listings coming on market and the number of listings going into contract continue to rise. These normally climb rapidly through spring, characteristically the biggest selling season of the year. (Autumn is also a big selling season, but significantly shorter.)
This report will review a number of standard indicators, as well as home values, interest rates, factors that can affect real estate markets, and how market cycles have broadly played out over the last 4 decades. March and April data will soon provide further indications of the market’s direction in 2022.
Overbidding List Prices in San Francisco
Percentage of Home Sales Closing over List Price, since 2018

Sales data reported to NORCAL MLS® ALLIANCE, per Infosparks. Reflecting the percentage of sales closing at sales prices over the final list prices. Data from sources deemed reliable, but may contain errors and subject to revision. All numbers are approximate, and may change with late-reported sales.
After a predictable drop in overbidding during the mid-winter period, an upward trend is appearing, typical of the spring selling season.
Avg. Sales Price to Original List Price Percentage (SP/LP %)
San Francisco Market Dynamics since 2018

Residential market activity reported to NORCAL MLS® ALLIANCE, per Infosparks. Data from sources deemed reliable, but may contain errors and subject to revision. All numbers are approximate, and may change with late-reported sales.
100% signifies an average sales price at original list price. Overbidding for both houses and condos climbed in 2021, but overbidding for houses runs much higher, reaching a high of 122% in February 2022.
Average Days on Market
San Francisco: Time on Market to Accepted Offer

Sales reported to NorCal MLS Alliance, per Infosparks. As reported to NorCal MLS Alliance. These analyses were performed in good faith with data derived from sources deemed reliable, but they may contain errors and are subject to revision. All numbers approximate.
Days-on-market is an indicator of how quickly buyers are snapping up listings, and typically rises and falls according to seasonal trends. Houses (blue line) generally sell faster than condos (green line), but both are trending very low.
San Francisco: Supply of Inventory by Price Segment
Active MLS Home Listings vs. 12 Months Sales*

*House, condo, co-op, TIC, townhouse activity reported to NorCal MLS Alliance. “Active” listings include “Coming Soon.” 12 months sales of listings marketed in MLS through mid-February 2022. Not all listings/sales are posted to MLS. Data from sources deemed reliable, but may contain errors and subject to revision. All numbers approximate. The number of active listings changes constantly.
This chart compares the number of active listings on March 1, 2022, to the number of homes sold over the past 12 months – and then calculates the weeks of inventory on the market. Generally speaking, under 13 weeks (3 months) of inventory is typically considered a “seller’s market.” Condo and TIC listings are clustered in the lower price segments (though some sell for very high prices).*
San Francisco Market Dynamics
Median HOUSE Sales Prices, 3-Month Rolling, since 2017

Each column reflects 3 months sales data. Sales reported to NorCal MLS Alliance. Median sales prices can fluctuate due to factors besides changes in fair market value. Analysis may contain errors and subject to revision. All numbers are approximate, and may change due to late-reported sales.
The median sales price is that price at which half the sales occurred for more and half for less, and typically fluctuates by season due to a number of factors. It is a very general statistic that disguises an enormous range of sales prices in the underlying sales. Values vary widely between neighborhoods.
Greater Bay Area: Annual, Median House Sales Prices
2020 to 2021, Percentage Appreciation Rates, by County*

*County house sales reported to NorCal MLS Alliance. San Mateo prices estimated per adjustment to CA Association of Realtors calculations. Data from sources deemed reliable but may contain errors and subject to revision. All numbers approximate, and may change with late reported sales. Percentages rounded.
*Percentages reflect year-over-year changes in ANNUAL median house sales prices.
Median price is that price at which half the sales occurred for more and half for less. It is a very general statistic that typically disguises an enormous range of sales prices in the individual underlying sales. It may change for reasons other than changes in fair market value – for example, an outsized increase in larger, more expensive home sales. Longer-term trends are more reliable than short-term changes.
San Francisco Market Dynamics
Median CONDO Sales Prices, 3-Month Rolling, since 2017

Each column reflects 3 months sales data. Sales reported to NorCal MLS Alliance. Median sales prices can fluctuate due to factors besides changes in fair market value. Analysis may contain errors and subject to revision. All numbers are approximate, and may change due to late-reported sales.
Each column reflects 3 months sales data. Median sales prices often fluctuate for other reasons besides changes to fair market value, including seasonal factors.
San Francisco Home Value Appreciation
Median Dollar per Square Foot Values – 3 Month Rolling, Since 2012

Dollar per Square Foot is based upon interior living space and doesn’t include garages, attics, basements, rooms built without permit, decks or patios. Not all sales report square footage. All numbers are approximate and subject to revision. Each data point on chart reflects 3 months of sales. Seasonal fluctuations are commmon.
Unlike other local counties, in San Francisco, the medial $/sq.ft. value for condos (green columns) typically runs higher than that for houses (gold line), but values started converging after the pandemic hit. Condo values are still below their peak, while house values hit new highs in 2021.
San Francisco Home Sales
Percentage of Sales by Era of Construction

Generally based on sales data per NorCal MLS Alliance in the 12 months through 2/15/22, but 2000-2021 condo figures include estimate of new-project condo sales unreported to MLS. Data derived from sources deemed reliable, but may contain errors and subject to revision. All numbers are approximate.
The vast majority of SF houses were built before 1960, but the relatively few built since 2000 have a median size – almost 3200 sq.ft. – 50%+ larger than other eras. 1940-1959, the postwar period during which much of south and southwest SF was built out, has the smallest median house size (about 1400 sq.ft.). Victorian & Edwardian houses overall sell for the highest median $/sq.ft. value ($1161).
New SF condo construction began in earnest during 1970’s and then soared from 2000 on, but condo conversions of units built before 1940 – Victorian, Edwardian, Span-Med, Marina-Style, located in older neighborhoods – have the largest median sizes and highest median sales prices.
New Listings Coming on Market
San Francisco Market Dynamics & Seasonality

Per Realtor.com Research, listings posted on site. Data from sources deemed reliable, but may contain errors and subject to revision. All numbers should be considered approximate.
The number of new listings coming on market has been rapidly increasing as the new year’s market gets underway, following a typical pattern for the spring selling season.
Listings Pending Sale (in Contract)
San Francisco Market Dynamics & Seasonality

Per Realtor.com Research, listings posted on site. Data from sources deemed reliable, but may contain errors and subject to revision. All numbers should be considered approximate.
This is a snapshot measure of how many pending listings can be expected on any given day of the specified month. February 2022 is running lower than February 2021, but well above that month in previous years. The number will almost certainly climb in the next few months.
Home Sales Volume by Month
San Francisco Market Dynamics & Seasonality

House, condo, TIC, co-op sales reported to NorCal MLS Alliance, per Infosparks. Activity reported to NorCal MLS Alliance, per Infosparks. Data from sources deemed reliable but may contain errors and subject to revision. All numbers are approximate. Last month numbers estimated based on available data.
Sales in one month mostly reflect accepted-offer activity in the previous month, i.e. February’s sales still reflect January’s slower market. Sales will continue to climb rapidly in March to probably peak in May or June.
San Francisco Short-Term Luxury Home Sales by Month
Homes Selling for $3 Million+, by Month
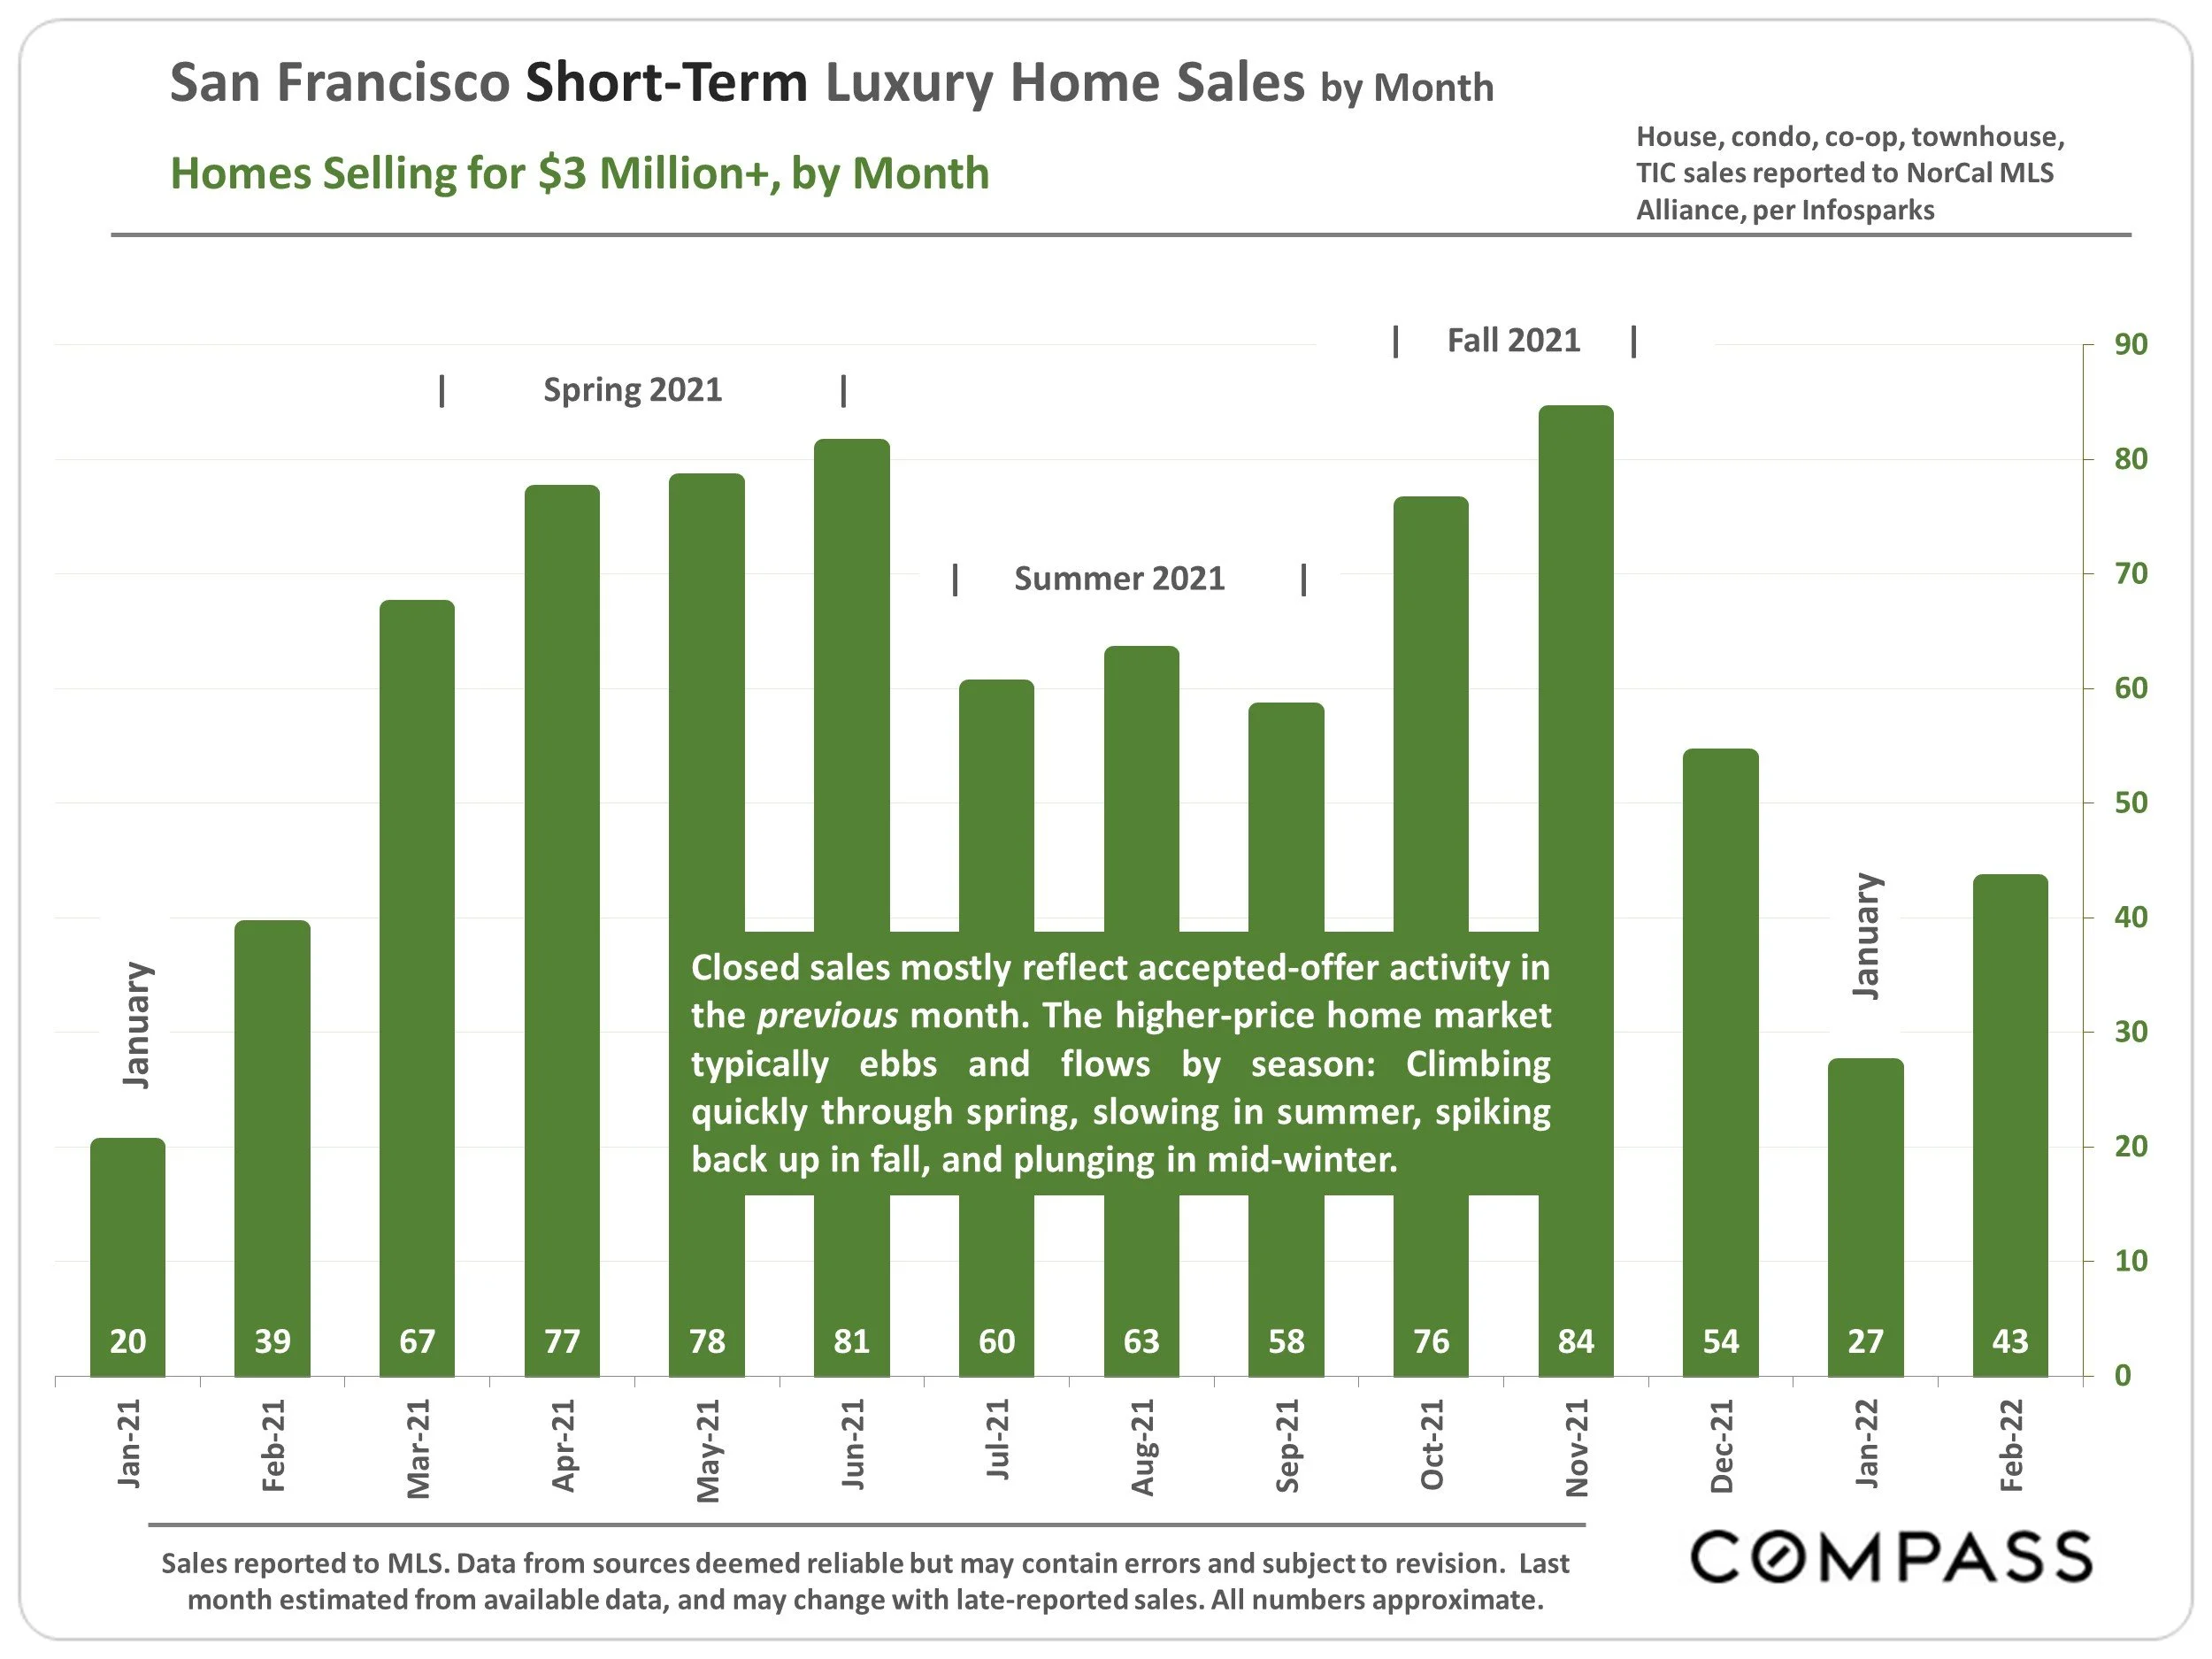
House, condo, co-op, townhouse, TIC sales reported to NorCal MLS Alliance, per Infosparks. Sales reported to MLS. Data from sources deemed reliable but may contain errors and subject to revision. Last month estimated from available data, and may change with late-reported sales. All numbers approximate.
Closed sales mostly reflect accepted-offer activity in the previous month. The higher-price home market typically ebbs and flows by season: Climbing quickly through spring, slowing in summer, spiking back up in fall, and plunging in mid-winter.
Bay Area Coastal Real Estate*
Median House Sales Prices, North to South, Sonoma to Monterey County
| Region | Sales Price | |
|---|---|---|
| Sea Ranch | $1,700,000 | |
| Bodega Bay, Dillon Beach | $1,627,500 | |
| Pt. Reyes/Inverness | $2,070,000 | |
| Bolinas | $2,000,000 | |
| Stinson & Muir Beaches | $4,450,000 | |
| Sea Cliff (SF) | $3,987,500 | |
| Outer Richmond (SF) | $1,950,000 | |
| Outer Sunset (SF) | $1,600,000 | |
| Pacifica | $1,352,500 | |
| Montara | $1,635,000 | |
| Moss Beach | $1,450,000 | |
| El Granada | $1,650,000 | |
| Half Moon Bay | $1,890,000 | |
| Pescadero | $1,300,000 | |
| City of Santa Cruz, West | $1,557,500 | |
| Capitola | $1,650,000 | |
| Seacliff (Santa Cruz) | $1,250,000 | |
| Rio del Mar/Seascape | $1,475,000 | |
| La Selva Beach | $1,462,500 | |
| Marina | $800,000 | |
| Seaside | $730,000 | |
| City of Monterey | $1,180,000 | |
| Pacific Grove | $1,325,000 | |
| Pebble Beach | $3,025,000 | |
| Carmel | $2,695,000 | |
| Big Sur, Big Sur Coast | $3,000,000 |
Many coastline and, especially, beachfront homes experienced a dramatic surge in buyer demand after the pandemic stuck, typically driving up prices dramatically.
What one gets for the price – home size, lot size, quality of construction, views, distance and access to the beach – varies widely within and between communities.
Median house sizes ranged from 1161 sq.ft. in Seaside to 2894 sq.ft. in Pebble Beach, and 3042 sq.ft. in the Sea Cliff neighborhood of San Francisco.
The 3 most expensive home sales during the period were all in Pebble Beach (Monterey County), all selling for over $32 million.
* Sales reported to NorCal MLS Alliance, 7/1/21 – mid-February 2022. Some coastal communities had relatively few sales during the period. Data from sources deemed reliable but may contain errors and subject to revision. Not all sales are reported to MLS. All numbers are approximate, and may change with late reported sales.
Mortgage Interest Rate Trends, 2016 – Present
30-Year Conforming Fixed-Rate Loans, Weekly Average Readings

Interest rates may fluctuate suddenly and dramatically, and it is very difficult to predict rate changes. Data from sources deemed reliable but not guaranteed. Anyone interested in residential home loans should consult with a qualified mortgage professional and their accountant.
Per Freddie Mac (FHLMC), on March 3, 2022, the weekly, average, 30-year interest rate was 3.76%, dropping from 3.92% in the 2 previous weeks, but up from 3.11% on 12/30/21. The low of 2.65% occurred in January 2021. In November 2018, the rate was 4.94%.
“Geopolitical tensions cause U.S. Treasury yields to recede this week as investors moved to the safey of bonds, leading to a drop in mortgage rates. While inflationary pressures remain, the cascading impacts of the war in Ukraine have created market uncertainty. Consequently, rates are expectd to stay low in the short-term, but will likely increase in the coming months.”
— Freddie Mac (FHLMC), March 3, 2022
Interest rates may fluctuate suddenly and dramatically, and it is very difficult to predict rate changes. Data from sources deemed reliable but not guaranteed. Anyone interested in residential home loans should consult with a qualified mortgage professional and their accountant.
Factors in Bay Area Real Estate Markets
Many of these factors’ effects can swing both positive and negative, and effects can also be counter-intuitive (e.g. a pandemic causing a fierce housing boom). Economic, political, social and ecological dynamics constantly arise, change and interact in difficult-to-predict ways. Developments can percolate gradually or occur unexpectedly, be short or long term, and have widely varying impacts (or no impact whatsoever) on different market segments.
Local economic conditions: High-tech booms, IPOs, employment, housing affordability & development, VC/foreign investment, work from home, pro/anti-business sentiment
Interest rates
Stock markets
Inflation
Consumer confidence
Household wealth; personal, corporate, govt. debt levels
Massive, governmental economic interventions (including by the Fed): post 9/11/2001, post 9/2008, post 2/2020
Natural disasters: COVID, 1989 earthquake, 2017-21 fires, drought, sea level rise
Domestic & foreign migration; federal immigration policy; demographic changes
Tax law e.g. real estate tax benefits & credits, 2017 SALT-deduction limitation
Investors & rental market dynamics
State income tax disparities
International economic/political events, e.g. large oil price swings, military or economic conflict, foreign economic crises, terrorist attacks
Local, state & national politics; elections
Social and quality of life issues: Crime, homelessness, cost of living, poverty, commute, schools, public services
Financial industry manipulation, fraud, engineering, recklessness: junk bonds, S&L collapse, predatory lending, abandonment of risk mgmt. & underwriting standards, CDOs & rating-agency deceit, insider trading, over-leveraged investing; irrational exuberance
Each factor in itself constitutes a complex topic.
Bay Area Real Estate Cycles*

*Approximate, good-faith illustration based on S&P CoreLogic Case-Shiller House Price Index for 5-county SF Metro Area. (Not based on median sales price changes.) Though we believe the broad cycles depicted generally apply across the Bay Area, substantial variations occurred, and % changes cannot be relied upon to apply to any specific home, submarket or market segment.
Financial and real estate markets typically move in cycles, but it is extremely difficult to predict how long a cycle will last, when it will transition to the next, and how dramatic the shift will be. The current up-cycle, starting in 2012, has seen spectacular appreciation in home and stock prices – which doesn’t imply it will either continue or soon end. Cycles can go on longer than expected, get second winds, or be suddenly and deeply affected by unexpected events. Shorter-term hiccups within cycles are not uncommon: One occurred in late-2015 with the Chinese stock market crash and oil-price turbulence; another followed the superheated spring-2018 market, after interest rates jumped and the S&P 500 dropped 20% in the 2nd half; in 2020, COVID initially had severe, negative effects on financial and certain housing segments. In all these cases, markets ultimately rebounded higher. In this simplified, smoothed-out chart, fluctuations within larger cycles are not shown.
Statistics are generalities, essentially summaries of widely disparate data generated by dozens, hundreds or thousands of unique, individual sales occurring within different time periods. They are best seen not as precise measurements, but as broad, comparative indicators, with reasonable margins of error. Anomalous fluctuations in statistics are not uncommon, especially in smaller, expensive market segments. Last period data should be considered estimates that may change with late-reported data. Different analytics programs sometimes define statistics – such as “active listings,” “days on market,” and “months supply of inventory” – differently: what is most meaningful are not specific calculations but the trends they illustrate. Most listing and sales data derives from the local or regional multi-listing service (MLS) of the area specified in the analysis, but not all listings or sales are reported to MLS and these won’t be reflected in the data. “Homes” signifies real-property, single-household housing units: houses, condos, co-ops, townhouses, duets and TICs (but not mobile homes), as applicable to each market. City/town names refer specifically to the named cities and towns, unless otherwise delineated. Multi-county metro areas will be specified as such. Data from sources deemed reliable, but may contain errors and subject to revision. All numbers to be considered approximate.
Many aspects of value cannot be adequately reflected in median and average statistics: curb appeal, age, condition, amenities, views, lot size, quality of outdoor space, “bonus” rooms, additional parking, quality of location within the neighborhood, and so on. How any of these statistics apply to any particular home is unknown without a specific comparative market analysis.
Median Sales Price is that price at which half the properties sold for more and half for less. It may be affected by seasonality, “unusual” events, or changes in inventory and buying trends, as well as by changes in fair market value. The median sales price for an area will often conceal an enormous variety of sales prices in the underlying individual sales.
Dollar per Square Foot is based upon the home’s interior living space and does not include garages, unfinished attics and basements, rooms built without permit, patios, decks or yards (though all those can add value to a home). These figures are usually derived from appraisals or tax records, but are sometimes unreliable (especially for older homes) or unreported altogether. The calculation can only be made on those home sales that reported square footage.
Compass is a real estate broker licensed by the State of California, DRE 01527235. Equal Housing Opportunity. This report has been prepared solely for information purposes. The information herein is based on or derived from information generally available to the public and/or from sources believed to be reliable. No representation or warranty can be given with respect to the accuracy or completeness of the information. Compass disclaims any and all liability relating to this report, including without limitation any express or implied representations or warranties for statements contained in, and omissions from, the report. Nothing contained herein is intended to be or should be read as any regulatory, legal, tax, accounting or other advice and Compass does not provide such advice. All opinions are subject to change without notice. Compass makes no representation regarding the accuracy of any statements regarding any references to the laws, statutes or regulations of any state are those of the author(s). Past performance is no guarantee of future results.