March 2021 Market Report

The Spring Market Began in January & Continues to Accelerate
New listings up 10%
Listings Pending Sale up 95%
Luxury House Sales up 87%
At the beginning of the new year, it is not unusual for buyers to jump back in much sooner than sellers, putting demand ahead of supply and accelerating the market as spring gets underway. When demand surges while new listings lag behind, buyers must increasingly compete, often heatedly, for appealing homes. This imbalance in supply and demand adds considerable pressure to the market with overbidding and price increases becoming much more common. And this has occurred with a vengeance in early 2021, especially within the city’s house market.
This report will look at median house and condo list and sales prices, supply and demand from a variety of angles, the surge in luxury home sales, and the recent jump in interest rates.
The charts are meant to be self explanatory but your questions are always welcome.
San Francisco House Sales
Median House Sales Prices

Year over year, house prices were up about 5%.
House Sales by Month

January is typically the slowest month of the year for sales, and while January 2021 was slower than previous months, house sales were about 45% higher than the previous January.
San Francisco Condo Sales
Median Condo/TIC/Co-op Sales Prices

Condo sales have been a mixed bag in the pandemic. Overall prices are down about 8% YOY, but it really depends on the features and amenities of the condo: How large the unit and the building, whether there’s outdoor space, how dense the environment is. Activity is picking up, and hopefully as vaccinations continue demand for condos will recover.
Condo/TIC/Co-op Sales by Month

Remarkably, the volume of condo/TIC/Co-op sales is significantly up YOY, about 48%. This probably indicates buyers with pent up demand taking advantage of a softened market. It’s less likely to be investors, as rents have been very soft in the city. To my mind, this is a good indicator that San Francisco’s condo market will remain robust.
San Francisco Market Snapshot
Supply & Demand by Property Type

Despite the softening of the condo market, the Months Supply of Inventory (MSI) is still just moderate, so there’s not a glut of them. Interestingly, the MSI for 2-4 unit buildings is somewhat higher, which could mean opportunity for investors—provided they’re willing to ride out the very soft rental market.
New Listings Coming on Market

YOY the number of listings coming on the market was up 10%. In general, listing volume has been up during the pandemic.
Active Listings on Market

While new listings are up 10%, the number of active listings YOY is up was up 66%. This can be attributed to longer Days on Market (DOM) for listings, and probably mostly condos.
Active Listings on Market by Price Segment

As of late February, about 75% of Coming Soon listings were condos/TIC/co-ops, with the balance being houses. About a third of active listings are priced under $1 million, with 93% of them being condos/TIC/co-ops. Nearly another third are priced under $1.5 million, 26% of which are houses. While competition remains strong in this market, there are opportunities for buyers looking for a starter home.
Listings Pending Sale

YOY the number of listings pending sale has nearly doubled. This is an indicator of just how hot the market is right now.
Home Sales Breakdown by Property Type & Bedroom Count

Condo and house sales are roughly equal in volume, but more 2BR condos sell in San Francisco than any other property type. Price per square foot tends to go down as the square footage increases.
San Francisco Luxury Home Sales
San Francisco Luxury House Market by Neighborhood

The central District 5, encompassing Noe, Eureka, and Cole Valleys plus Ashbury Heights and Buena Vista Heights, saw the greatest volume of luxury house sales, with 122 homes over the price of $3 million.
San Francisco Luxury House Market Seasonality

Luxury home sales are significantly up YOY, probably again indicating a pandemic-fueled desire for more space.
San Francisco Ultra-Luxury House Market

Even steeper was the rise in ultra-luxury homes priced $5 million and more.
San Francisco Luxury Condo/TIC/Co-op Market Sales by Neighborhood
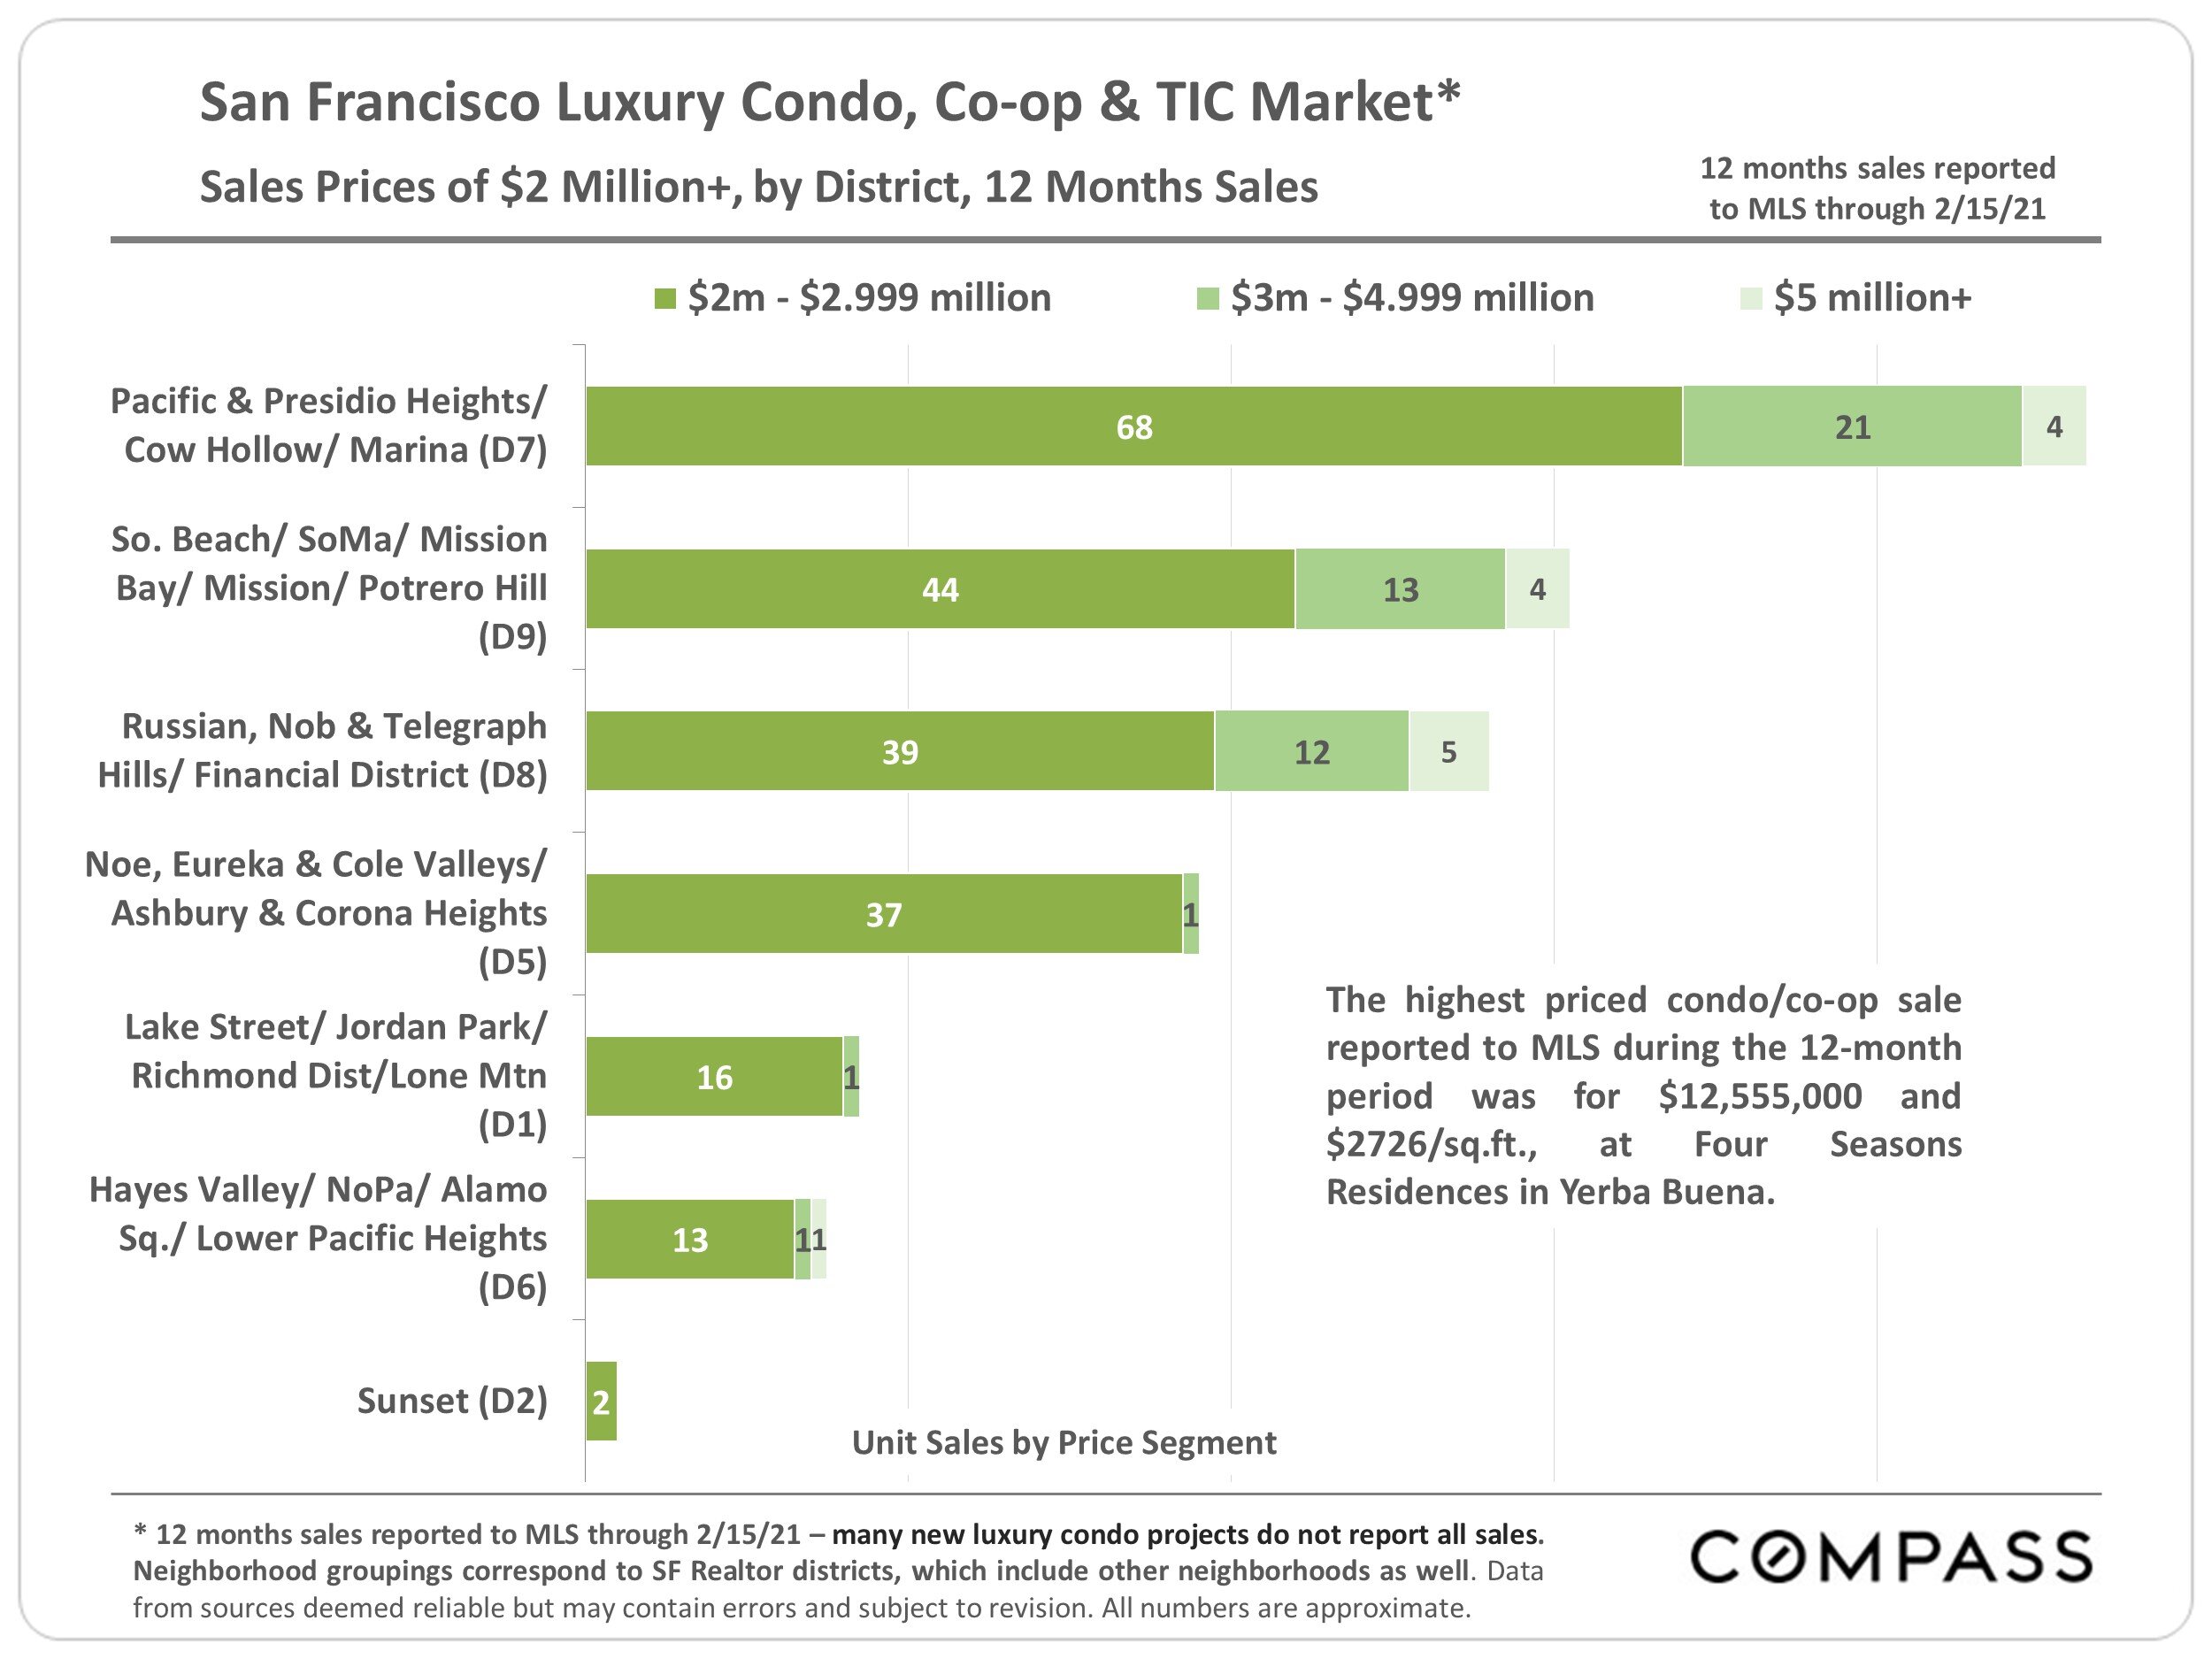
Luxury condos priced $2 million and up remain centered in the northern neighborhoods of Pacific & Presidio Heights, Marina, and Cow Hollow.
San Francisco Luxury Condo/TIC/Co-op Market Sales Prices

Despite an overall softening of the condo market, luxury condo sales were up about 17% YOY, and will likely continue as the pandemic recedes.
Mortgages and Interest Rates
Mortgage Interest Rate Trends

Interest rates have risen about 14% from their all-time lows in January of this year. However, they still remain drastically lower than they have been historically.
Mortgage Debt Service Payments as a Percentage of Disposable Personal Income

The combination of four factors—home prices, mortgage debt, interest rates, and income—determine the burden on household finances. The recent lows in interest rates have contributed to favorable conditions for home ownership in this regard.