June 2022 Market Report: Clear Indications of Cooling Market Dynamics

Photo by Koushik Chowdavarapu on Unsplash
Sales are declining, and the numbers of active listings and price reductions are increasing. But the homes that are selling are still, on average, selling quickly for well over asking: Median sales prices and year-over-year appreciation rates remain high. When an overheated market cools, the change is typically gradual (absent a disaster event), and does not mean the market is weak by any normal standard. As an analogy, if traffic is going 100 miles per hour and drops to 65, it feels a lot slower, but cannot reasonably be described as slow. People will continue to have excellent personal and financial reasons to buy and sell homes.
As of late spring, across the Bay Area, less expensive home sales have been considerably impacted by rising interest rates – and this certainly occurred in San Francisco, particularly in the condo market. Sales of higher-price homes (mostly houses) have held up much better, but cooling demand is beginning to show up in pending-sale data. (Affluent buyers tend to be more affected by financial markets, which became very volatile in May.) Market changes are often uneven in the early months of a transition, with one home selling in days at well over list price, while next door, the seller has to reduce their price to get an offer. As markets cool, buyers become more discriminating; negative conditions previously ignored are noticed; more negotiation occurs; multiple offers and overbidding decline. Listings that are well prepared, show well, and priced right will have an increasing advantage.
The homes that are not selling quickly won’t affect overbid and days-on-market statistics until future months. The high appreciation rates of the last 2 years will almost certainly start to decline (which is not the same thing as an imminent decline in prices). After peaking in spring, activity in San Francisco typically slows through summer. Autumn usually sees another big, short spike in activity prior to the mid-winter slowdown. These are common seasonal dynamics, though other factors can come into play.
This report will look at recent, year-over-year changes in inventory and demand, while also reviewing longer-term trends for more context. San Francisco Home Price Appreciation
Median HOUSE Sales Price by Year, 1993 – Present

Per CA. Association of Realtors or NorCal MLS Alliance. Median sales price is that price at which half the sales occurred for more and half for less. Data from sources deemed reliable but may contain errors and subject to revision. All numbers are approximate.
Median prices are generalities, most useful to discern broad market trends. They can be affected by other factors besides changes in fair market value. The city contains neighborhoods of widely varying values.
San Francisco Home Price Appreciation
Median CONDO Sales Price by Year, 1993 – Present

Per sales reported to NorCal MLS Alliance. Median sales price is that price at which half the sales occurred for more and half for less. Data from sources deemed reliable but may contain errors and subject to revision. All numbers are approximate.
Median prices are generalities, most useful to discern broad market trends. They can be affected by other factors besides changes in fair market value. The city contains condo projects and neighborhoods of widely varying values.
San Francisco Year-over-Year Appreciation Rates since 2020
Percentage Change in Year-over-Year, 3-Month-Rolling Median HOUSE Sales Price*

*3-month rolling sales reported to NorCal MLS Alliance, per Infosparks. Data from sources deemed reliable, but may contain errors and subject to revision. All numbers approximate.
Since May 2021, year-over-year median house sales price appreciation rates have remained relatively steady, typically running between 11% and 15%.
Comparing the 3-month rolling median house sales price with the same period of the previous year to calculate the percentage change. Median sales prices can be affected by a variety of factors other than changes in fair market value, as can year-over-year appreciation rates.
Median prices are generalities, most useful to discern broad market trends. They can be affected by other factors besides changes in fair market value. The city contains condo projects and neighborhoods of widely varying values.
San Francisco Year-over-Year Condo Appreciation Rates since 2020
Percentage Change in Year-over-Year, 3-Month-Rolling Median CONDO Sales Price*

*3-month rolling sales reported to NorCal MLS Alliance, per Infosparks. Data from sources deemed reliable, but may contain errors and subject to revision. All numbers approximate.
Comparing the 3-month rolling median condo sales price with the same period of the previous year to calculate the percentage change. Median sales prices can be affected by a variety of factors other than changes in fair market value, as can year-over-year appreciation rates.
Condo median sales prices generally dropped in the aftermath of the pandemic hitting.
New Listings Coming on Market
San Francisco Market Dynamics: Year-over-Year Comparison

Per Realtor.com Research, listings posted on site. Data from sources deemed reliable, but may contain errors and subject to revision. May not include “coming soon” listings posted to MLS. All numbers should be considered approximate.
Comparing May 2022 with May 2021, the number of new listings was up 3%.
Active Listings
San Francisco Market: Year-over-Year Comparison

Per Realtor.com Research, listings posted on site. Data from sources deemed reliable, but may contain errors and subject to revision. May not include “coming soon” listings posted to MLS. All numbers should be considered approximate.
This is a snapshot measure of how many active listings can be expected on any given day of the specified month. As of June 1, 2022, there were 1362 active and coming soon listings posted to MLS: 76% of these listings were condos, co-ops and TICs, and 24% were houses.
Comparing May 2022 with May 2021, the number of active listings on a given day of the month was up 23%.
Active Listings on Market – Longer-Term Trends
San Francisco Real Estate Market Dynamics & Seasonality

Per Realtor.com Research, listings posted on site. Data from sources deemed reliable, but may contain errors and subject to revision. All numbers should be considered approximate.
This is a snapshot measure of how many active listings can be expected on any given day of the specified month.
The number of active listings on a given day is affected by 1) how many new listings come on market, 2) how quickly buyers snap them up, 3) the sustained heat of the market over time, and 4) how many sellers pull their homes off the market without selling. The number typically ebbs and flows by season.
Listings Accepting Offers (Going into Contract)
San Francisco Market Dynamics: Year-over-Year Comparison

House, condo, TIC, co-op, townhouse activity reported to NorCal MLS Alliance, per Infosparks. Data from sources deemed reliable but may contain errors and subject to revision. All numbers approximate. Last month estimated based on available data, and may change with late-reported activity.
Comparing May 2022 with May 2021, the number of listings accepting offers was down about 22%, with houses down about 19%, and condos, co-ops and TICs down 24%.
The number of listings accepting offers is a leading indicator of sales volume in the following 3 to 6 weeks.
Listings Accepting Offers- Longer-Term Trends
San Francisco Market Dynamics & Seasonality

Data from sources deemed reliable but may contain errors and subject to revision. All numbers approximate. Last month numbers estimated based on available data, and may change with late reported activity.
The number of listings accepting offers is a leading indicator of sales volume in the following 3 to 6 weeks.
April & May 2022 saw atypical declines from March in the number of listings going into contract, as well as being down on a year-over-year basis. The drops in activity were concentrated in the condo market.
Monthly Home Sales Volume
San Francisco Market Dynamics: Year-over-Year Comparison

House, condo, TIC, co-op, townhouse sales reported to NorCal MLS Alliance, per Infosparks. Data from sources deemed reliable but may contain errors and subject to revision. All numbers approximate. Last month estimated based on available data, and may change with late-reported activity. Does not include sales unreported to MLS.
Comparing May 2022 with May 2021, the number of home sales was down 8%, with house sales up about 7%, and condo, co-op and TIC sales down about 17%.
Sales in one month mostly reflect accepted-offer activity in the previous month.
Home Sales Volume by Month – Longer-Term Trends
San Francisco Market Dynamics & Seasonality
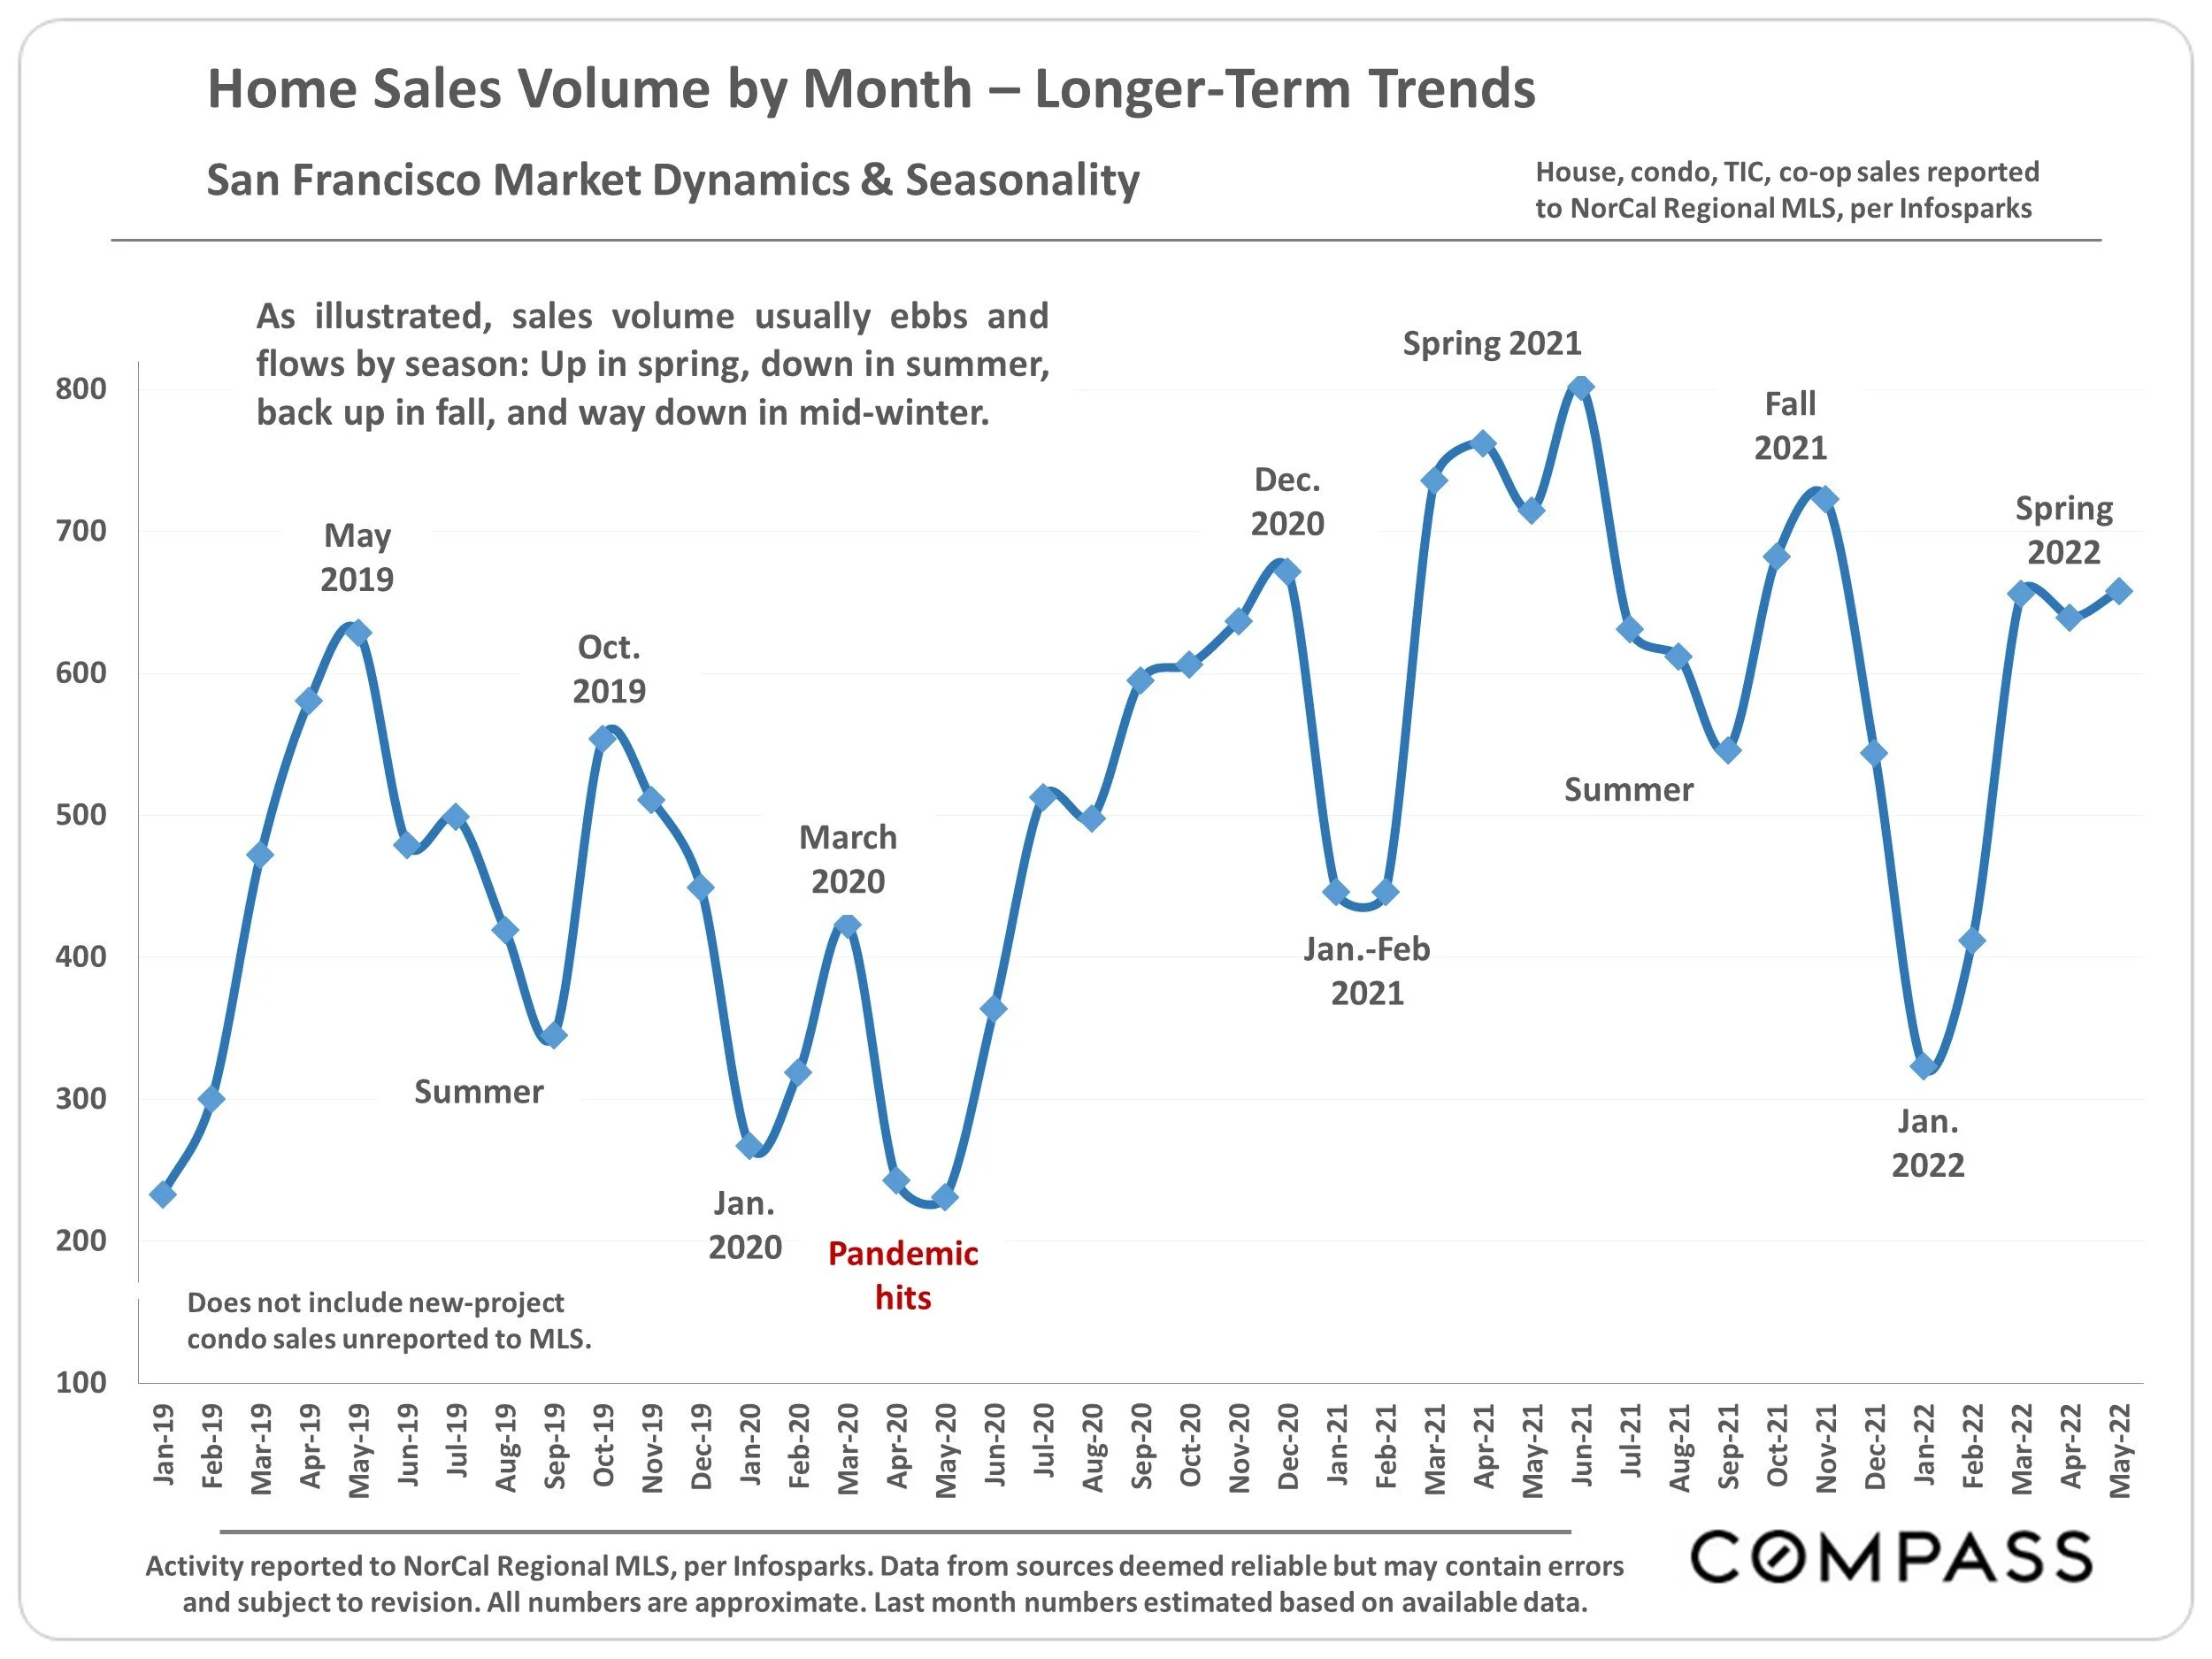
Activity reported to NorCal Regional MLS, per Infosparks. Data from sources deemed reliable but may contain errors and subject to revision. All numbers are approximate. Last month numbers estimated based on available data.
As illustrated, sales volume usually ebbs and flows by season: Up in spring, down in summer, back up in fall, and way down in mid-winter.
San Francisco Market Activity by Price Segment
Year-over-Year Comparison, May 2022 vs. May 2021
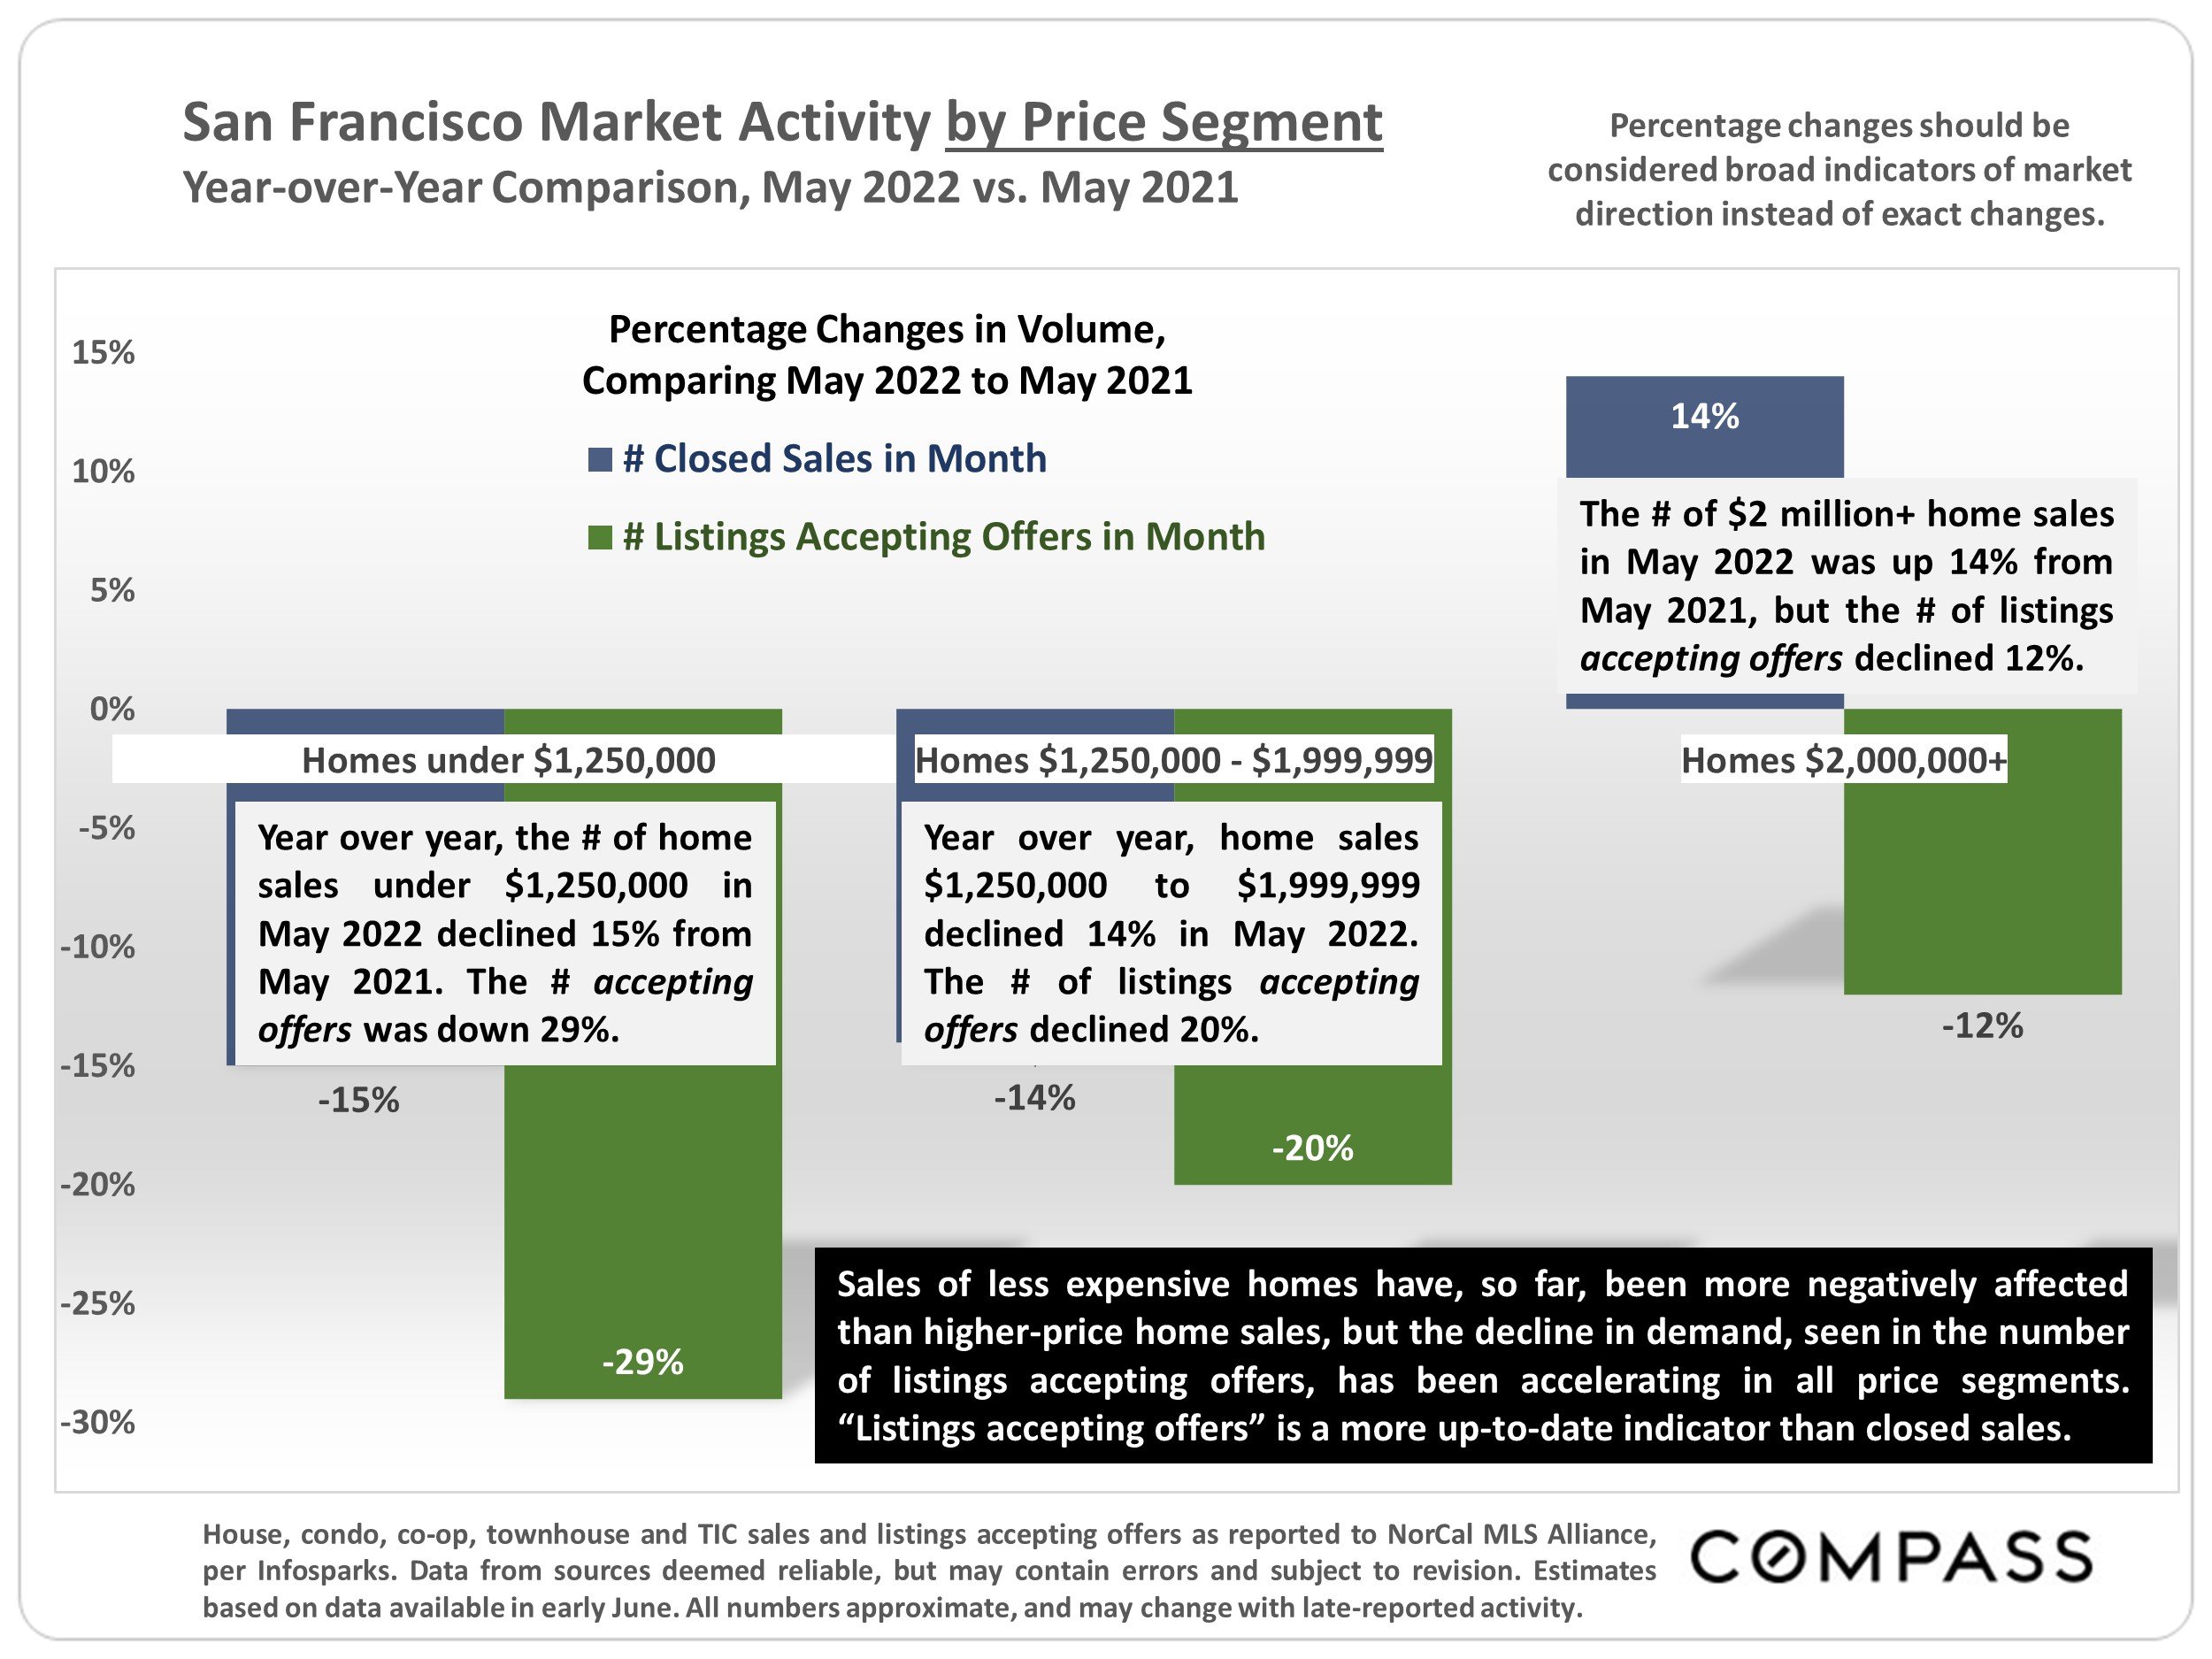
House, condo, co-op, townhouse and TIC sales and listings accepting offers as reported to NorCal MLS Alliance, per Infosparks. Data from sources deemed reliable, but may contain errors and subject to revision. Estimates based on data available in early June. All numbers approximate, and may change with late-reported activity.
Percentage changes should be considered broad indicators of market direction instead of exact changes.
Year over year, the # of home sales under $1,250,000 in May 2022 declined 15% from May 2021. The # accepting offers was down 29%.
Year over year, home sales$1,250,000 to $1,999,999 declined 14% in May 2022. The # of listings accepting offers declined 20%.
The # of $2 million+ home sales in May 2022 was up 14% from May 2021, but the # of listings accepting offers declined 12%.
Sales of less expensive homes have, so far, been more negatively affected than higher-price home sales, but the decline in demand, seen in the number of listings accepting offers, has been accelerating in all price segments. “Listings accepting offers” is a more up-to-date indicator than closed sales.
San Francisco Luxury Home Sales
Homes Selling for $3 Million+, by Month, 2020 to Present

Sales reported to MLS. Data from sources deemed reliable but may contain errors and subject to revision. Last month estimated from available data, and may change with late-reported sales. All numbers approximate.
San Francisco Long-Term Luxury Home Sales Trends
12-Month Rolling Sales Volumes since 2005*

Sales reported to NorCal MLS Alliance, per Infosparks. “Condo/Co-op Sales” include TICs and townhouses. Data from sources deemed reliable, but may contain errors and subject to revision. All numbers approximate.
Each data point reflects 12 months of MLS sales: Average monthly sales volumes = 1/12 of these compiled figures. Using 12-month rolling data removes the effect of seasonality on sales, but will lag short-term changes in the market.
Price Reductions on Active Listings
San Francisco Market Dynamics: Year-over-Year Comparison

Per Realtor.com Research, listings posted on site. Data from sources deemed reliable, but may contain errors and subject to revision. All numbers should be considered approximate.
Comparing May 2022 with May 2021, the number of price reductions was up 50%.
Overbidding List Prices in San Francisco
Percentage of Home Sales Closing over List Price, since 2018

Reflecting the percentage of sales closing at sales prices over the final list prices. Data from sources deemed reliable, but may contain errors and subject to revision. All numbers are approximate, and may change with late-reported sales.
Sales in one month mostly reflect market dynamics in the previous month. Seasonal ebbs and flows are typical.
Though sales have dropped in recent months, especially in lower price segments, the great majority of those homes which have sold continued to sell for over asking price.
Selected Macroeconomic Charts
S&P 500 Index: Financial Market Volatility in 2022
Daily Closing Prices, January 1 – May 31, 2022

Data per MarketWatch.com, daily closing prices. Data from source deemed reliable, but may contain errors and subject to revision. Number should be considered approximate.
The affluent buyers behind higher-price real estate markets tend to be more affected by financial market volatility/declines than by interest rate changes. In May 2022, the S&P 500 Index flirted with “bear market” territory – defined as a 20%+ drop from peak value –before recovering. (The Nasdaq Index is currently in a bear market.)
Mortgage Interest Rate Trends, 2016 – Present
30-Year Conforming Fixed-Rate Loans, Weekly Average Readings

Interest rates may fluctuate suddenly and dramatically, and it is very difficult to predict rate changes. Data from sources deemed reliable but not guaranteed. Anyone interested in residential home loans should consult with a qualified mortgage professional and their accountant.
Per Freddie Mac (FHLMC), on June 9, 2022, the weekly, average, 30-year interest rate was 5.23%.
At the end of 2021, the 30-year rate was 3.11%. The historic low of 2.65% was in January 2021. In November 2018, the rate was 4.94%.
Average Annual Interest Rates since 1981
30-Year Conforming Fixed-Rate Loans, by Year, plus Latest Weekly Reading

Interest rates may fluctuate suddenly and dramatically. Data from sources deemed reliable but not guaranteed. Anyone interested in residential home loans should consult with a qualified mortgage professional and accountant.
Annual average interest rates, plus historic low hit in January 2021, the 12/30/21 reading, and latest weekly reading, as published by the FHLMC (Freddie Mac).
Financial Markets in 2022
Percentage Declines since January 3, 2022
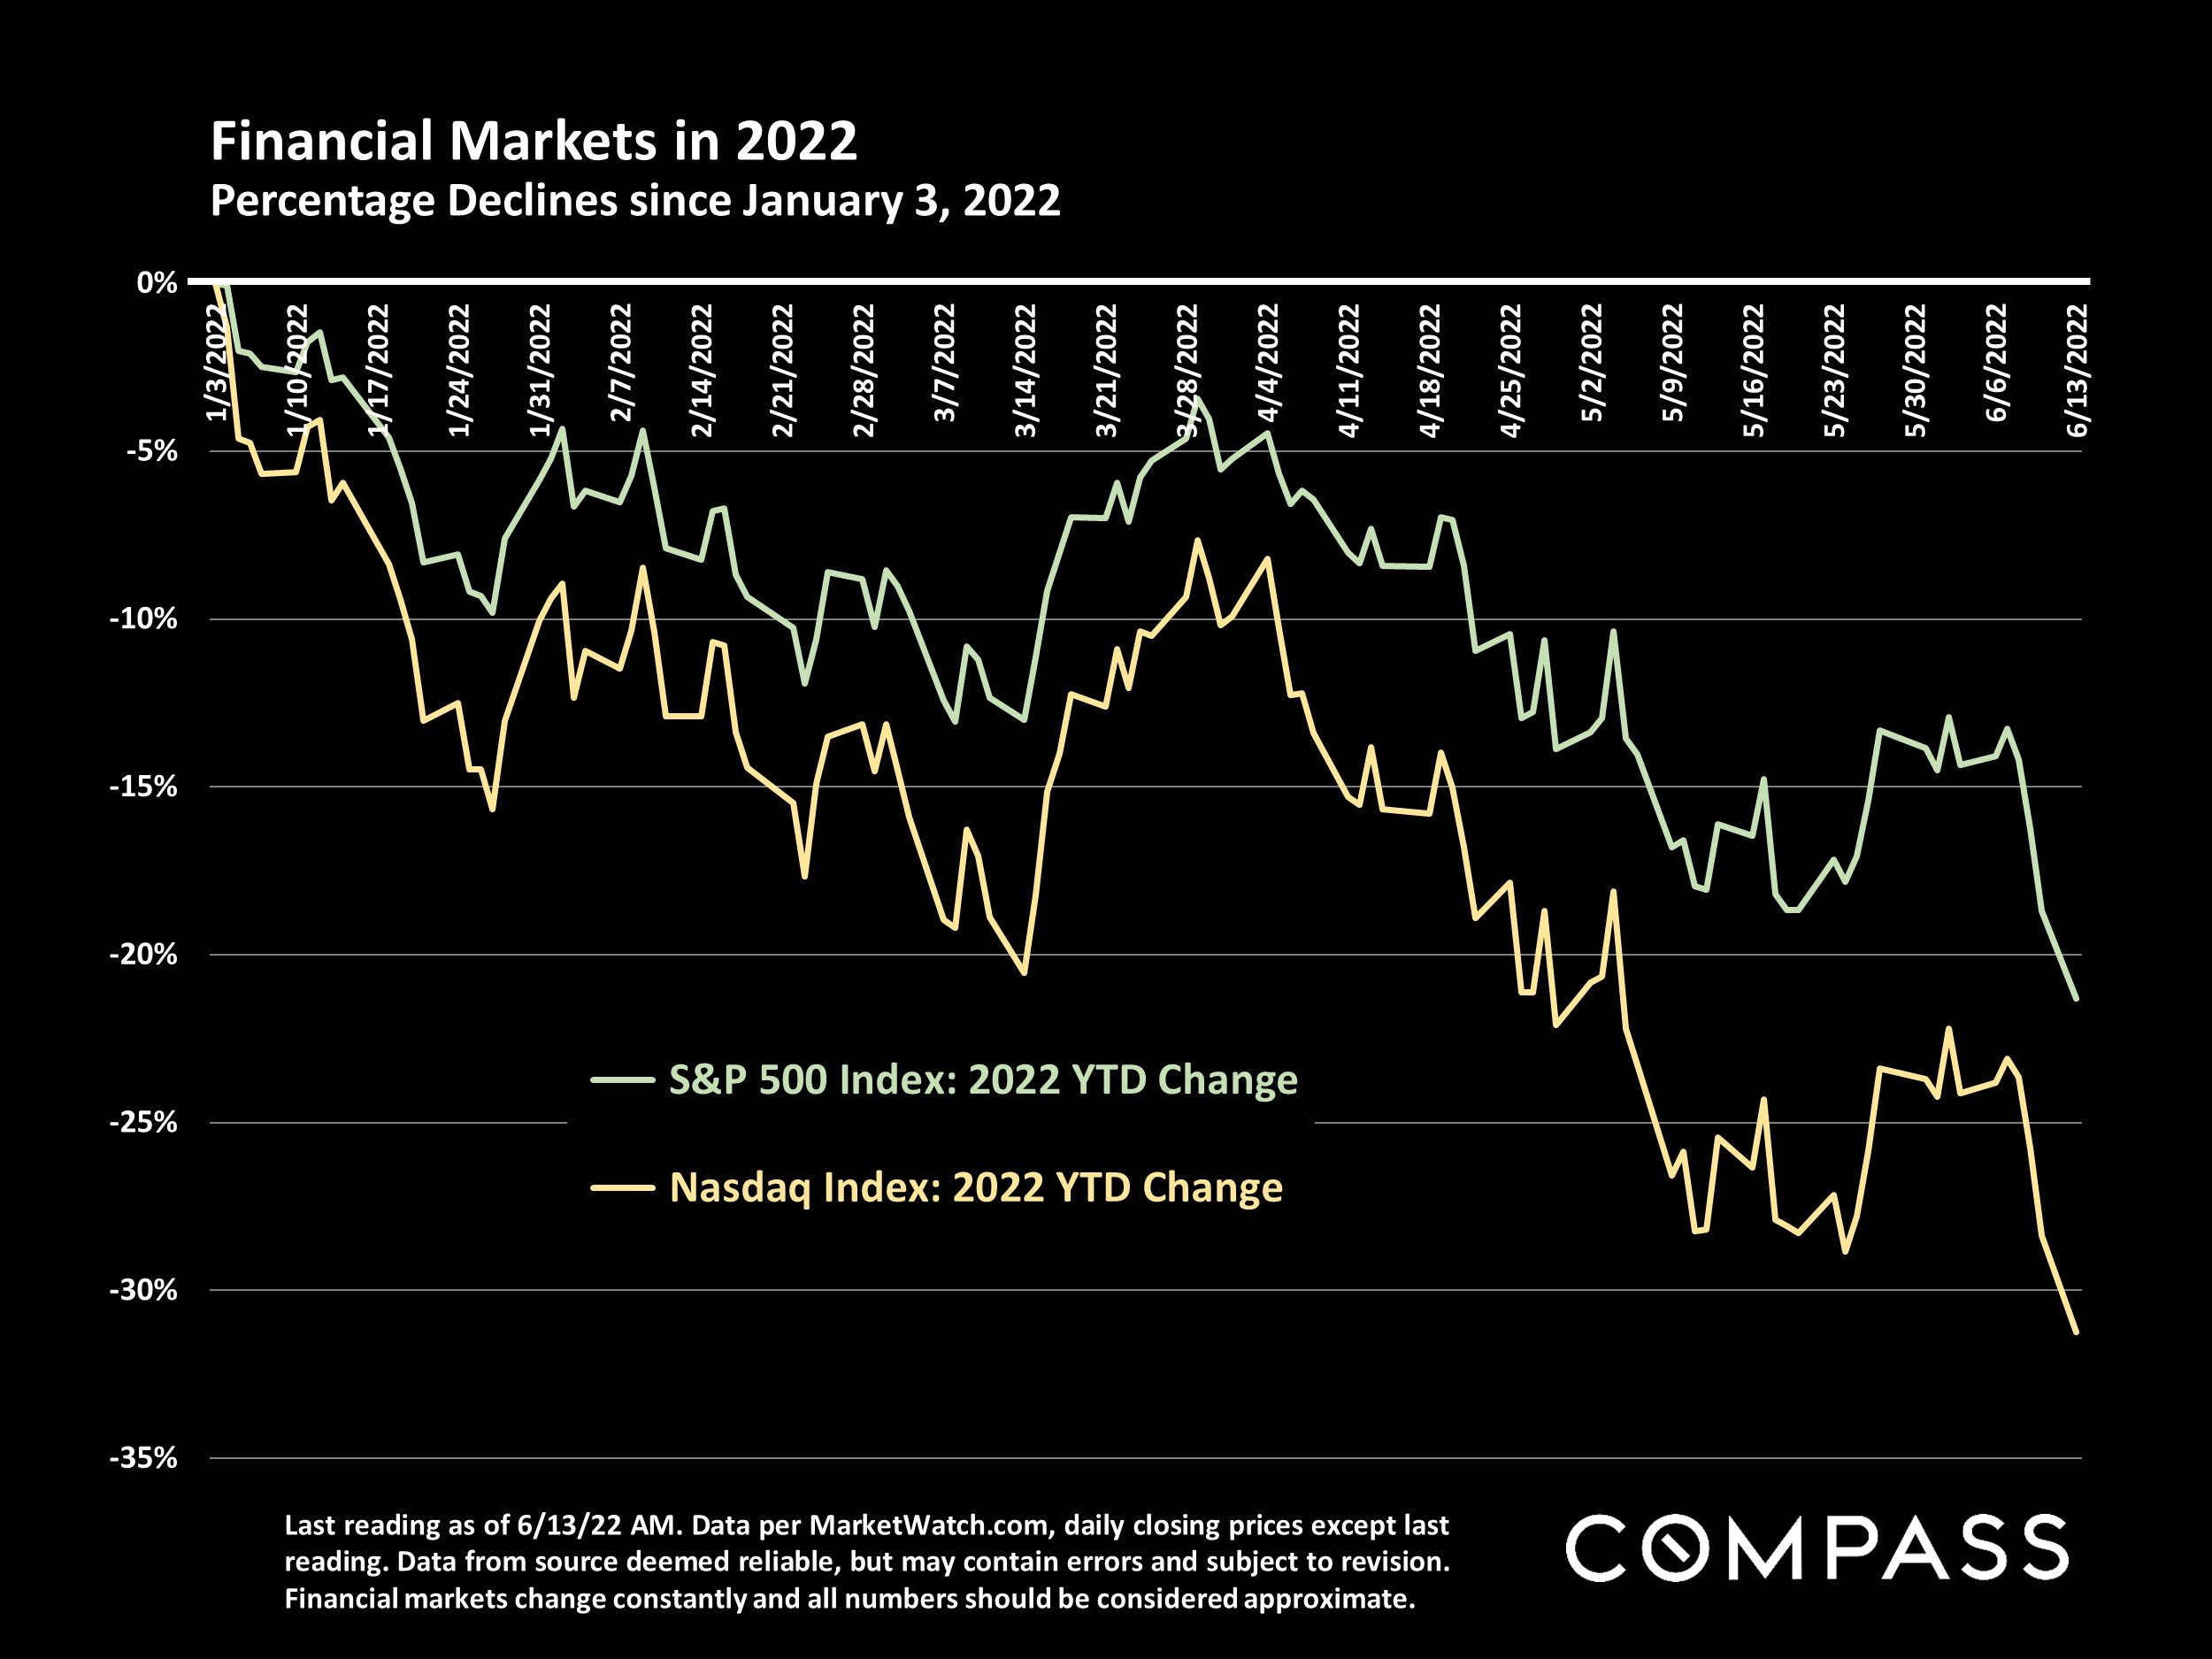
Last reading as of 6/13/22 AM. Data per MarketWatch.com, daily closing prices except last reading. Data from source deemed reliable, but may contain errors and subject to revision. Financial markets change constantly and all numbers should be considered approximate.
S&P 500 Stock Index, 1994 – June 13, 2022
January Opening Values except as specified
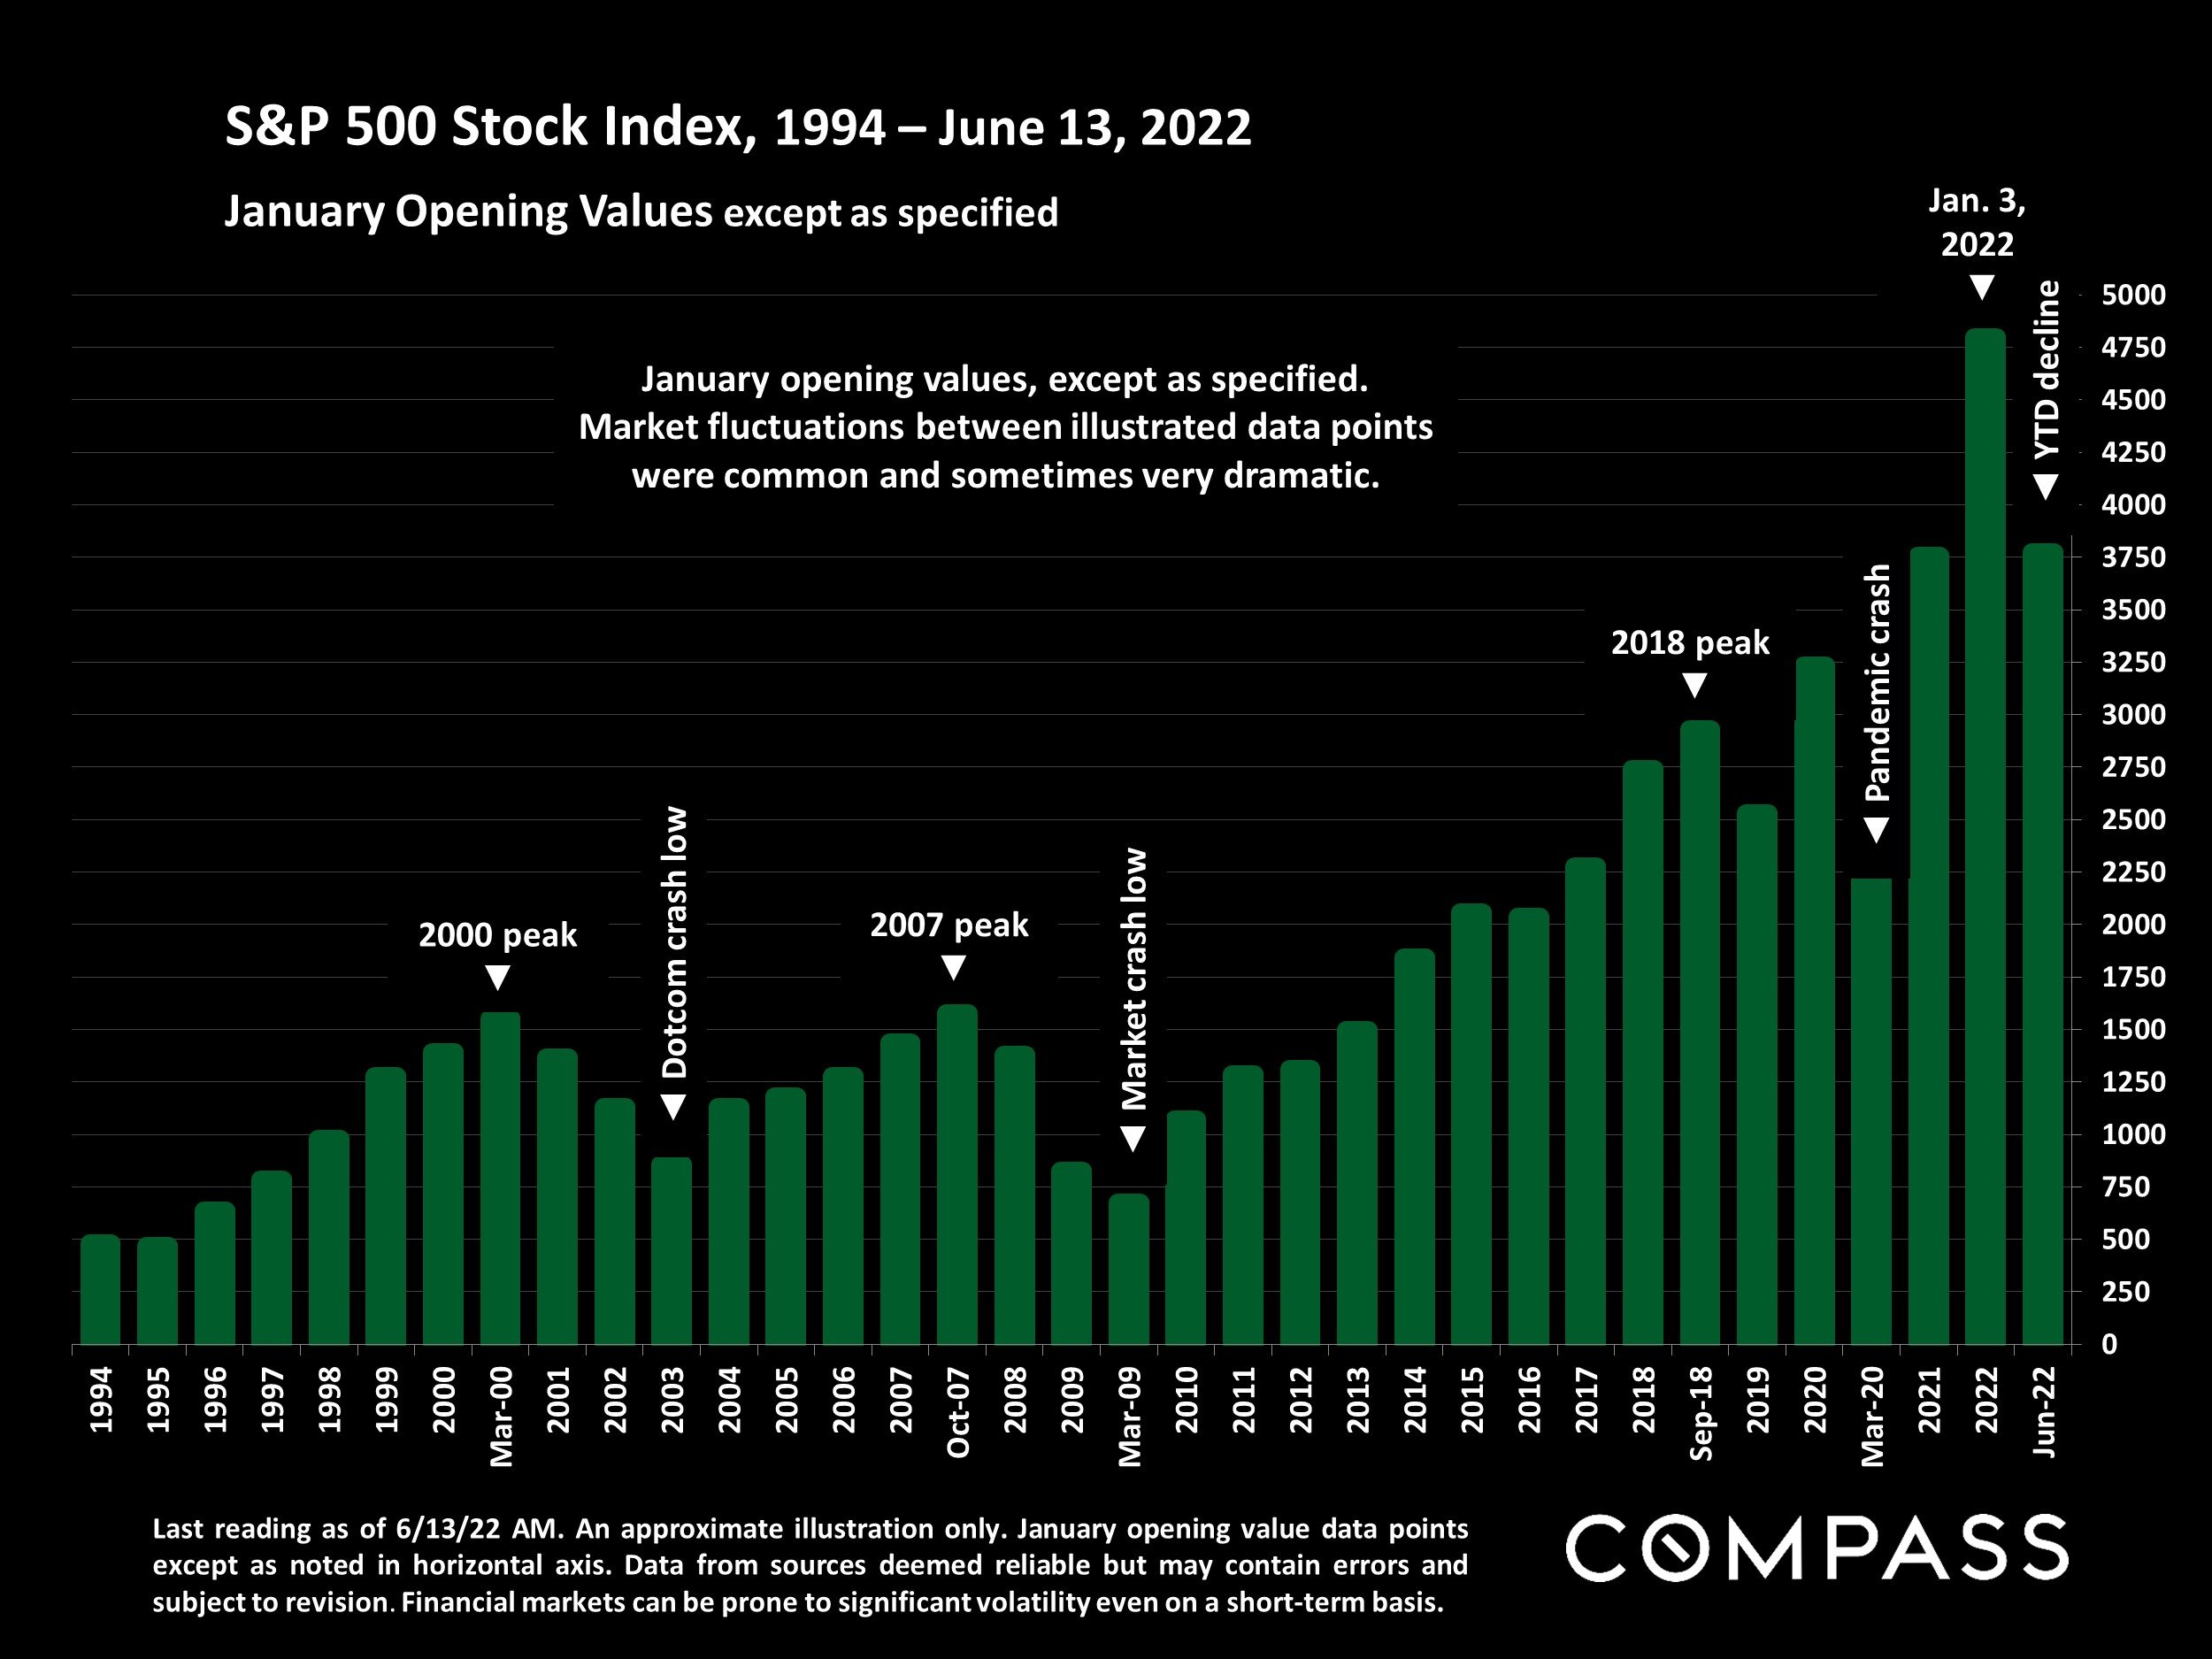
Last reading as of 6/13/22 AM. An approximate illustration only. January opening value data points except as noted in horizontal axis. Data from sources deemed reliable but may contain errors and subject to revision. Financial markets can be prone to significant volatility even on a short-term basis.
January opening values, except as specified. Market fluctuations between illustrated data points were common and sometimes very dramatic.
Inflation: Consumer Price Index, 1982 – 2022*
3-Month-Rolling Average, Year-over-Year % Change

*3-month rolling average of Consumer Price Index for All Urban Consumers: All Items in U.S. City Average [CPIAUCSL], retrieved from FRED, Federal Reserve Bank of St. Louis; https://fred.stlouisfed.org/series/CPIAUCSL, June 2022. Data from U.S. Bureau of Labor Statistics. All Items (CPIAUCSL) is a price index of a basket of goods and services paid by urban consumers. This particular index includes roughly 88 percent of the total population. Data from sources deemed reliable, but may contain errors and subject to revision. All numbers approximate.
In May 2022, inflation hit its highest point since January 1982.
Consumer Sentiment (Confidence) Index
University of Michigan, January 1978 – April 2022

2-month rolling trend line. University of Michigan: Consumer Sentiment [UMCSENT], retrieved from Federal Reserve Bank of St. Louis. Not seasonally adjusted. 1966, Q1 = 100.
In 2022, the consumer confidence reading hits its lowest point since 2011.
San Francisco Bay Area Employment Trends*
Number of Employed Residents, 2000 – April 2022

*San Francisco, Marin, Alameda, Contra Costa, San Mateo & Santa Clara Counties. Line delineates 2-month rolling average. Last month’s data is labeled “preliminary” by EDD. EDD often goes back to revise past data releases. Data from sources deemed reliable but may contain errors and subject to revision. Approximate illustration.
Despite economic headwinds, employment in the Bay Area is approaching pre-pandemic highs.
National Housing Market Reports
Being the center of high-tech industry and other unique local factors deeply affect Bay Area real estate, but the differences between local and national trends are generally more of degree than direction. General economic conditions and broad market trends up or down typically run on similar tracks across the U.S.
“Active inventory continued to grow, rising 11% above one year ago. In a few short weeks, we’ve observed a significant turnaround in the number of homes available for sale, going from essentially flat at the beginning of May to +11% in the last week of the month.” Realtor.com Report, June 6, 2022
“‘Pending contracts... better reflect the timelier impact from higher mortgage rates than do closings," said Lawrence Yun, NAR's chief economist. "The latest contract signings [in April] mark six consecutive months of declines and are at the slowest pace in nearly a decade.’ With mortgage rates rising, Yun forecasts existing-home sales to wane by 9% in 2022 and home price appreciation to moderate to 5% by year's end.” National Association of Realtors, May 26, 2022
“Mortgage rates continued to inch downward this week but are still significantly higher than last year, affecting affordability and purchase demand. Heading into the summer, the potential homebuyer pool has shrunk, supply is on the rise and the housing market is normalizing.” FHLMC (Freddie Mac), June 2, 2022
“Mortgage applications decreased to the lowest level since December 2018, as the purchase market continues to struggle with supply and affordability challenges... applications last week were 14 percent lower than last year, with more activity in the larger loan sizes. Demand is [still] high at the upper end of the market, [where] supply and affordability challenges are not as detrimental... as they are to first-time buyers.” Joel Kan, Mortgage Bankers Association, June 1, 2022
Statistics are generalities, essentially summaries of widely disparate data generated by dozens, hundreds or thousands of unique, individual sales occurring within different time periods. They are best seen not as precise measurements, but as broad, comparative indicators, with reasonable margins of error. Anomalous fluctuations in statistics are not uncommon, especially in smaller, expensive market segments. Last period data should be considered estimates that may change with late-reported data. Different analytics programs sometimes define statistics – such as “active listings,” “days on market,” and “months supply of inventory” – differently: what is most meaningful are not specific calculations but the trends they illustrate. Most listing and sales data derives from the local or regional multi-listing service (MLS) of the area specified in the analysis, but not all listings or sales are reported to MLS and these won’t be reflected in the data. “Homes” signifies real-property, single-household housing units: houses, condos, co-ops, townhouses, duets and TICs (but not mobile homes), as applicable to each market. City/town names refer specifically to the named cities and towns, unless otherwise delineated. Multi-county metro areas will be specified as such. Data from sources deemed reliable, but may contain errors and subject to revision. All numbers to be considered approximate.
Many aspects of value cannot be adequately reflected in median and average statistics: curb appeal, age, condition, amenities, views, lot size, quality of outdoor space, “bonus” rooms, additional parking, quality of location within the neighborhood, and so on. How any of these statistics apply to any particular home is unknown without a specific comparative market analysis.
Median Sales Price is that price at which half the properties sold for more and half for less. It may be affected by seasonality, “unusual” events, or changes in inventory and buying trends, as well as by changes in fair market value. The median sales price for an area will often conceal an enormous variety of sales prices in the underlying individual sales.
Dollar per Square Foot is based upon the home’s interior living space and does not include garages, unfinished attics and basements, rooms built without permit, patios, decks or yards (though all those can add value to a home). These figures are usually derived from appraisals or tax records, but are sometimes unreliable (especially for older homes) or unreported altogether. The calculation can only be made on those home sales that reported square footage.
Compass is a real estate broker licensed by the State of California, DRE 01527235. Equal Housing Opportunity. This report has been prepared solely for information purposes. The information herein is based on or derived from information generally available to the public and/or from sources believed to be reliable. No representation or warranty can be given with respect to the accuracy or completeness of the information. Compass disclaims any and all liability relating to this report, including without limitation any express or implied representations or warranties for statements contained in, and omissions from, the report. Nothing contained herein is intended to be or should be read as any regulatory, legal, tax, accounting or other advice and Compass does not provide such advice. All opinions are subject to change without notice. Compass makes no representation regarding the accuracy of any statements regarding any references to the laws, statutes or regulations of any state are those of the author(s). Past performance is no guarantee of future results.