June 2021 Market Report

Photo ©Julie Gebhardt (@juliegeb on Instagram). Used with permission.
Home Sales Volumes
San Francisco Market Dynamics, 2018 — Spring 2021
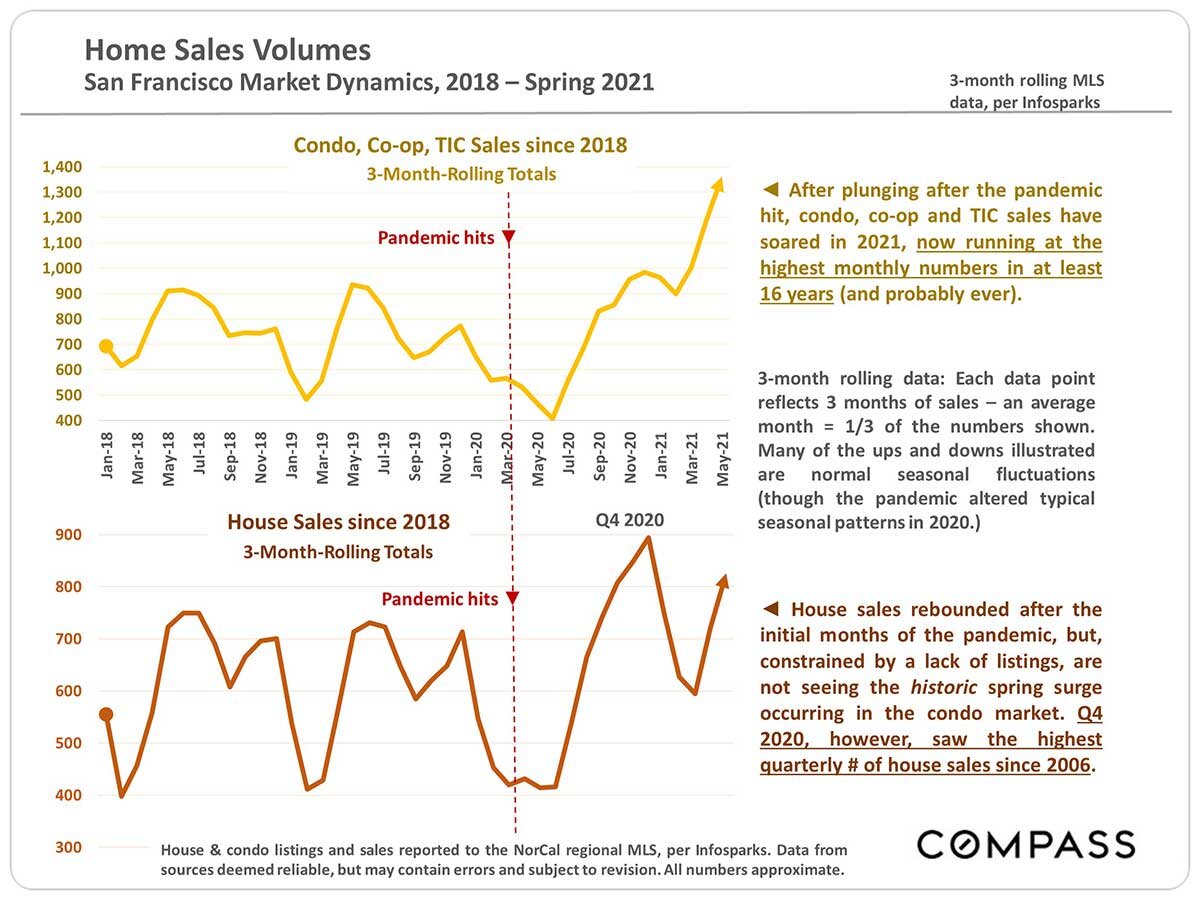
After plunging after the pandemic hit, condo, co-op and TIC sales have soared in 2021, now running at the highest monthly numbers in at least 16 years (and probably ever).
3-month rolling data: Each data point reflects 3 months of sales — an average month = 1/3 of the numbers shown. Many of the ups and downs illustrated are normal seasonal fluctuations (though the pandemic altered typical seasonal patterns in 2020.)
House sales rebounded after the initial months of the pandemic, but, constrained by a lack of listings, are not seeing the historic spring surge occurring in the condo market. Q4 2020, however, saw the highest quarterly # of house sales since 2006.
House & condo listings and sales reported to the NorCal regional INALS, per Infosparks. Data from sources deemed reliable, but may contain errors and subject to revision. All numbers approximate.
Luxury Home Sales by Month
San Francisco Market Dynamics, 2018 — Spring 2021
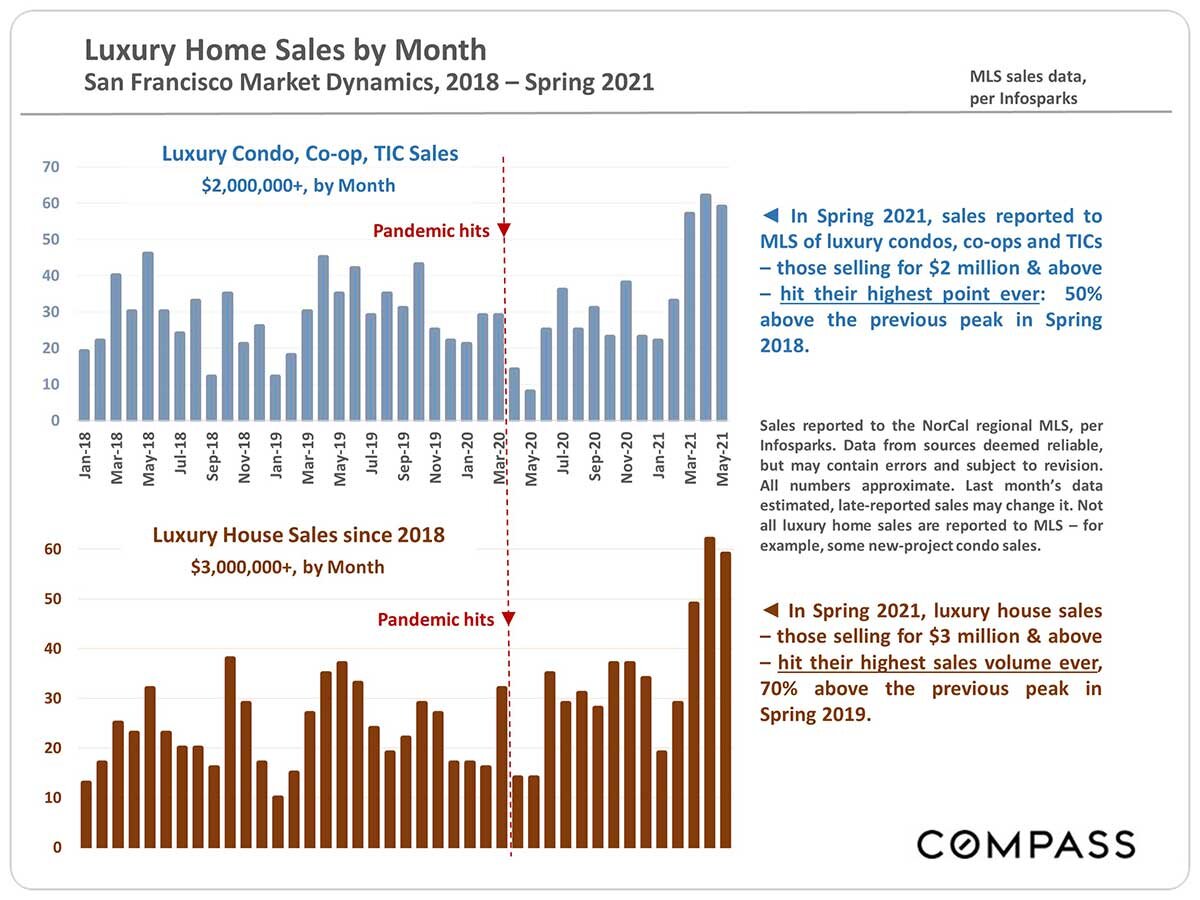
In Spring 2021, sales reported to MLS of luxury condos, co-ops and TICs — those selling for $2 million & above — hit their highest point ever: 50% above the previous peak in Spring 2018.
Sales reported to the NorCal regional MLS, per Infosparks. Data from sources deemed reliable, but may contain errors and subject to revision. All numbers approximate. Last month's data estimated, late-reported sales may change it. Not all luxury home sales are reported to MLS — for example, some new-project condo sales.
In Spring 2021, luxury house sales — those selling for $3 million & above — hit their highest sales volume ever, 70% above the previous peak in Spring 2019.
San Francisco Median House Sales Prices
3-Month Rolling House Sales, since 2017

Besides changes in fair market value, median sales prices often fluctuate due to seasonal factors — rising in spring and sometimes autumn, dropping in mid-summer and mid-winter (though the pandemic altered typical trends in 2020).
The high pressure of buyer demand this spring, coupled with the low supply of listings pushed the median house sales price to a new high.
San Francisco Median 2-BR Condo Sales Prices
2-Bedroom Condo Sales, 3-Month Rolling, since 2017

Median sales prices often fluctuate due to seasonal factors, rising in spring and autumn, dropping in mid-winter. With the pandemic-drop in prices and the rollout of vaccines, Buyers appear to see SF condos as a buying opportunity. Sales volume and prices are now jumping.
San Francisco Metro Area Residential Rent Trends*
5-County Region since 2014: SF, San Mateo, Marin, Alameda & Contra Costa

This Index covers 5 counties, so the trend-line is a broad generality. Since the pandemic struck, the City of San Francisco market was hit hardest, with an estimated 20% - 25% drop in rents. Other urban, and office and university dominated markets saw smaller, but still substantial drops.
According to some rental websites, metro-area rents have begun to reverse their declines. The rollout of vaccines, reduction in unemployment, and general reopening of offices, retail and universities will almost certainly continue to impact the situation.
* Zillow Observed Rent Index (ZORI): A smoothed measure of the typical observed market rate rent across a given region: https://www.zillow.com/research/data/#rental-data. Details available in ZORI methodology. Compass cannot validate the methodology used. All numbers should be considered approximate.
New Listings Coming on Market within Month
San Francisco Market Dynamics & Seasonality, for houses and condos

The quantity of new listings coming on market typically ebbs and flows by season, though it can be affected by other factors as well.
Per Realtor.com Research: https://www.realtor.com/research/data/, listings posted on site. Data from sources deemed reliable, but may contain errors and subject to revision. All numbers should be considered approximate.
Active Listings on Market
San Francisco Real Estate Market Dynamics, for houses and condos

After radically declining from the autumn peak, the inventory of listings for sale is still running somewhat higher than in recent springs, however there is a large difference between property types: As of early June 2021, condos, co-ops and TICs made up 71% of the active/coming-soon listings in SFMLS, and houses only 29%.
This is a snapshot measure of how many active listings can be expected on any given day of the specified month. This number is affected by 2 major dynamics: 1) how many new listings come on market, and 2) how quickly buyers purchase them.
Per Realtor.com Research: https://www.realtor.com/research/data/, listings posted on site. Data from sources deemed reliable, but may contain errors and subject to revision. All numbers should be considered approximate.
Listings Pending Sale
For house and condo listings pending sale (in contract)

This statistic may be the most up-to-date indicator of buyer demand, though it can be constrained by low levels of inventory, and is deeply affected by market seasonality.
This is a snapshot measure of how many pending listings can be expected on any given day of the specified month.
Per Realtor.com Research: https://www.realtor.com/research/data/, listings posted on site. Data from sources deemed reliable, but may contain errors and subject to revision. All numbers should be considered approximate.
Overbidding List Prices
San Francisco Market Dynamics, 2018 — Spring 2021

Rebound in Overbidding
The higher the percentage of sales closing over list price, the stronger the buyer demand. The percentages have been quickly rising in recent months after their post-pandemic drop. The % for houses in particular, at 77%, is running very high.
114% for houses = an average sales price 14% over asking price. 103% for condos, co-ops and TICs = 3% over asking price. As the market heated up in 2021, overbidding percentages have risen. Average condo sales prices just recently moved back above list prices after the pandemic drop.
Sales reported to the NorCal regional MLS, per Infosparks. Data from sources deemed reliable, but may contain errors and subject to revision. All numbers approximate.
Days on Market, Months Supply of Inventory
San Francisco Market Dynamics, 2018 — Spring 2021
3-month rolling MLS sales data, per Infosparks

Less Inventory, Selling Faster
The lower the median days on market (DOM), the faster buyers are putting new listings into contract. After jumping for houses and soaring for condos, co-ops and TICs after the pandemic hit, DOM has rapidly declined. DOM for houses in particular is extremely low.
MSI measures supply vs. demand, i.e. how long it would take to sell the active listings on the market at the rate of sale over the past year. After spiking up for houses and soaring for condos, co-ops and TICs after the pandemic hit, MSI has plunged and continues to fall. Inventory is particularly tight for house listings.
Sales reported to the NorCal regional MIS, per Infosparks. Data from sources deemed reliable, but may contain errors and subject to revision. All numbers approximate.
Why the Decline in Listings for Sale?
A review of general issues, some of which apply to Bay Area markets more than others.
Higher demand means a greater percentage of listings sell and sell more quickly. This significantly reduces the number of active listings on the market on any given day.
As homes have become more expensive, homeowners have skewed older — and older people move much less frequently: They're more affluent, more settled in careers, their families more established. The percentage of the population 55 years+ who own homes is over 76%; the percentage under 35 is 39% (per Statista). The median age of homebuyers was 47 in 2019 vs. 39 in 2010 (per National Association of Realtors). As of 2020, homeowners stay in their homes an average of about 8 years vs. about 5 in 2010 (per Attom Solutions). This reduced turnover has an enormous impact on inventory.
Note: Condo owners generally skew younger than house owners and move more frequently. That, plus new-condo construction and pandemic-related issues, kept Bay Area condo inventory substantially higher than house inventory over the past year.Investors, institutional and individual, have been purchasing a higher percentage of U.S. homes to use as rental properties — currently 20% of housing sales (per John Burns Consulting). This began during the foreclosure crisis (by hedge funds) and accelerated with the current, desperate search for yield. Investors sell much less frequently, with considerable impact on the resale market. Besides income —boosted by extremely low, mortgage rates — and potential appreciation, investors also enjoy very significant tax advantages, enhanced in the tax-law changes of 2017.
Some homeowners are turning their homes into long-term rentals or vacation rentals (such as Airbnb) instead of selling them when moving to new homes.
In many markets, new home construction has declined (or remained extremely low for years).
It appears more homes are being marketed off-MIS. Strictly speaking, this is not a reduction in inventory, but does reduce the # of listings available using typical sources of public listing data (and affecting the statistics based on them).
San Francisco Residential 2-4 Unit Building Market
Sales Closing Escrow in Month, Spring 2018 — Spring 2021

The pandemic initially hammered the 2019 sales of 2-4 unit buildings — due to a number of tenant, rent, vacancy rate and eviction issues — but Spring 2021 has generally seen higher demand.
Activity reported to local MLS associations, per Broker Metrics. Last month reading may change with late reported sales. Data from sources deemed reliable but may contain errors and subject to revision. All numbers approximate.
San Francisco Housing Unit Breakdown
Inventory by Property Type

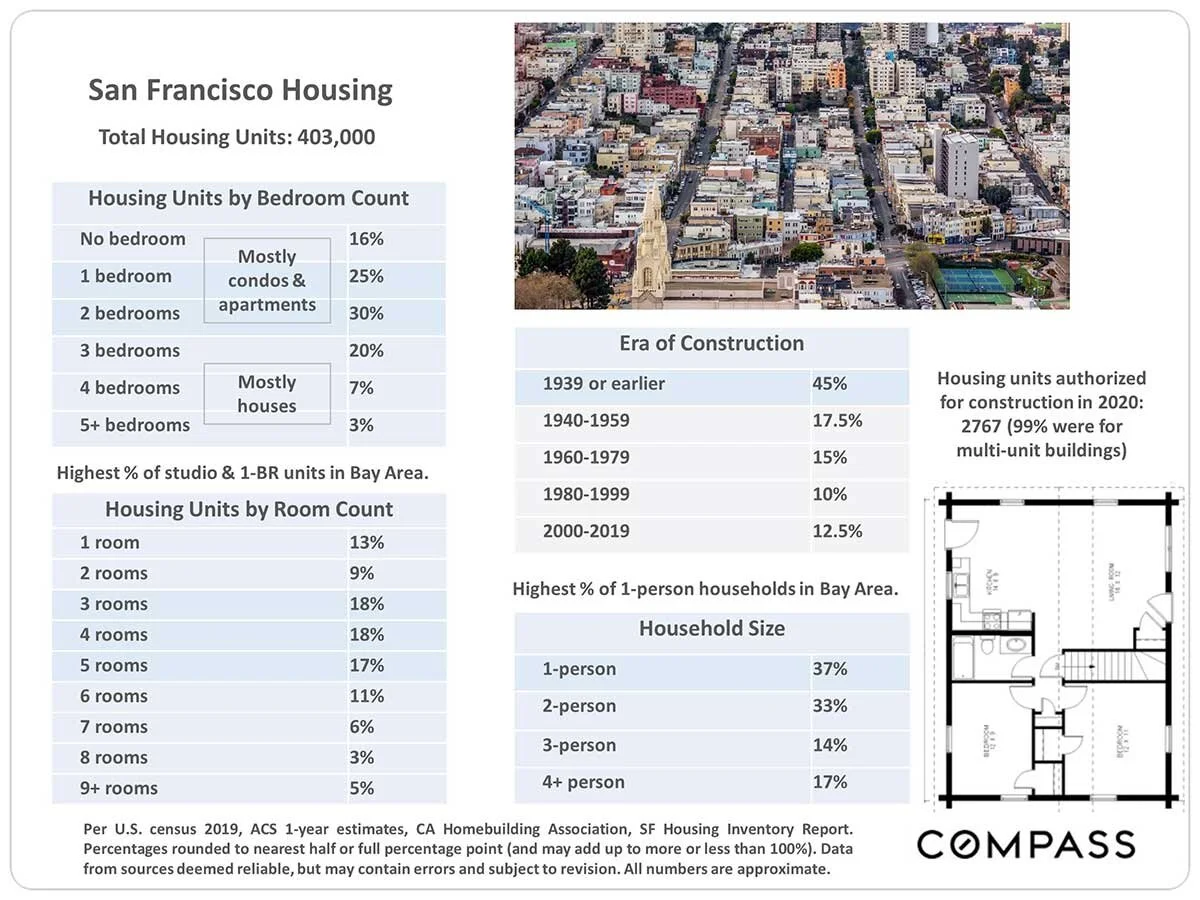
Multi-unit buildings include rental units, and (very) approximately 74,000-76,000 condos, 1000 co-ops and 5000 TICs. Approx. 45% of SF housing was built before WWII.
Of occupied units in 2020, 37% were owner-occupied and 63% by tenants: The highest tenant ratio in the Bay Area.
Housing stock increased by 1% in 2020. 99% of the increase was in multi-unit buildings, 1% in houses. 20% were built as affordable housing.
Very approximate estimates based on data from the U.S. Census, the SF Depts. of Planning & Public Works, MLS and other sources deemed reliable. These numbers are constantly changing due to new construction, condo conversion, unit alteration or demolition, and conversion of multi-unit buildings into TICs.
San Francisco Housing
Total Housing Units: 403,000
Median House Sales Prices (+ SF Condo)
by Bay Area County, Q1 2021

Median sales price is that price at which half the sales occurred for more and half for less. It is a very general statistic that disguises an enormous range of sales prices in the county's individual sales. It may fluctuate for reasons other than changes in fair market value, and seasonal fluctuations are common.
Per California Association of Realtors Traditional Housing Affordability Index (HAI): https://www.car.org/en/marketdata/data/haitraditional. Analysis made in good faith, but may contain errors and subject to revision. All numbers to be considered approximate.
Percentage of Households Able to Afford Median Priced House
by Bay Area County, Q1 2020 vs. Q1 2021
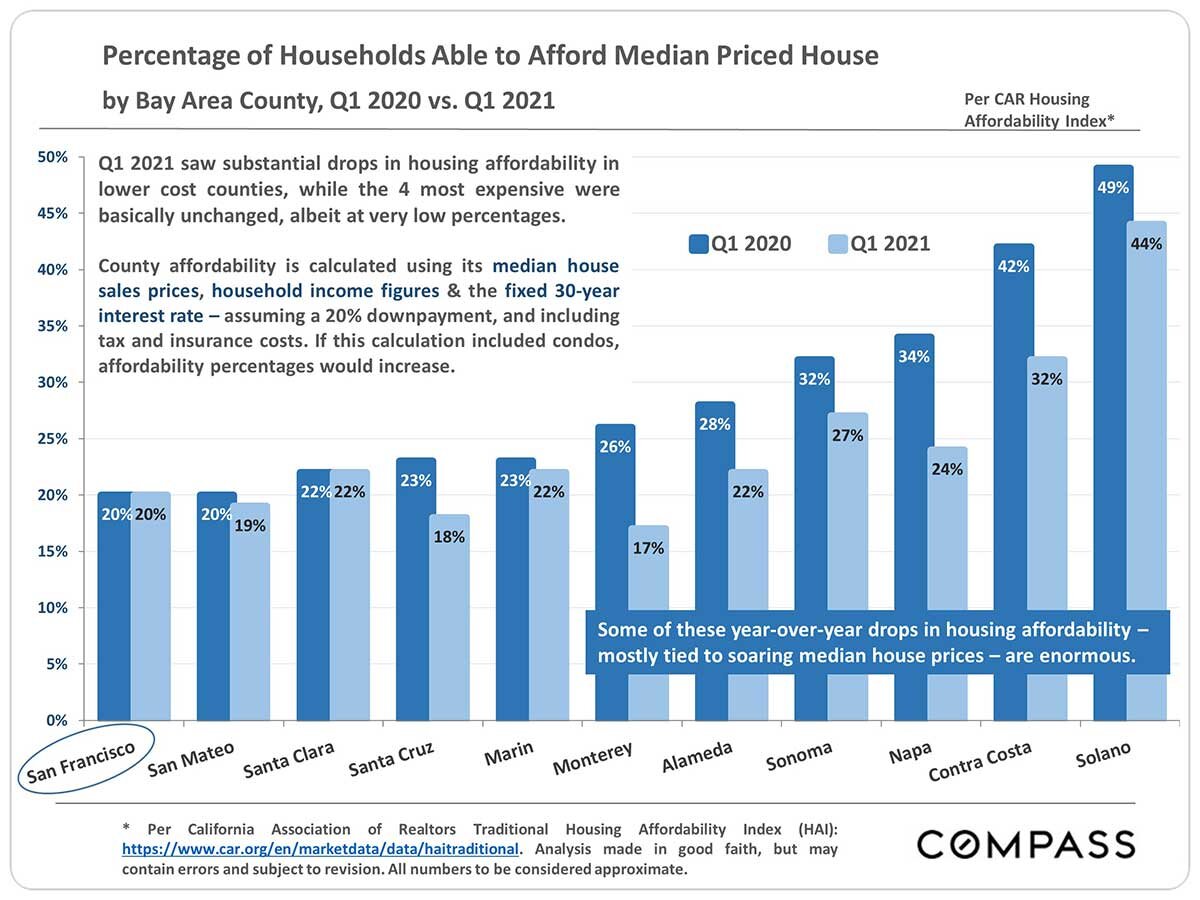
Q1 2021 saw substantial drops in housing affordability in lower cost counties, while the 4 most expensive were basically unchanged, albeit at very low percentages.
County affordability is calculated using its median house sales prices, household income figures & the fixed 30-year interest rate — assuming a 20% downpayment, and including tax and insurance costs. If this calculation included condos, affordability percentages would increase.
Some of these year-over-year drops in housing affordability —mostly tied to soaring median house prices — are enormous.
* Per California Association of Realtors Traditional Housing Affordability Index (HAI): https://www.car.org/en/marketdata/data/haitraditional. Analysis made in good faith, but may contain errors and subject to revision. All numbers to be considered approximate.