July 2021 Market Report

Image by Veit on Flickr.com, via Creative Commons license
San Francisco Comeback Metrics
Excerpts from the report, "Status of the Re-Opening of the San Francisco Economy" issued on June 24, 2021 by the Office of the Controller & the Office of Economic Analysis of the City & County of San Francisco; Lead authors Ted Egan, Ph.D., Chief Economist & Asim Khan, Ph.D., Senior Economist
More than 45% of small businesses in SF remain closed. (Source: Womply, Opportunity Insights)
The five-county San Francisco metro area continues to lag comparable metro areas in office attendance, with a weekly office attendance rate below 20%. (Source: Kastle Systems)
As of Q1 2021, the commercial office vacancy rate remains very high at over 16%. The pre-pandemic average was below 6%. (Source: Jones Lang LaSalle)
At about 35%, the hotel occupancy rate, though recovering, remains well below the pre-pandemic average, which was close to 80%. (Source: STR)
Employment in the San Francisco Metro Division is recovering slowly. Total employment is still down 10% from its pre-pandemic level. The unemployment rate has declined from over 12% at the start of the pandemic, to 5.1% in May of this year. The pre-pandemic rate was just over 2%. (Source: CA Employment Development Department)
Evening freeway speeds in downtown have dropped, indicating the return of traffic congestion. However, BART ridership to downtown San Francisco stations was 12% of normal in May. (Sources: San Francisco County Transportation Authority, BART)
Travel at SF International Airport, though recovering, is still almost 70% down from 2019. (Source: San Francisco International Airport)
There are clear signs of recovery in apartment rents in San Francisco. However, average asking rents remain approximately 19% below pre-pandemic rates. (Source: Apartmentlist)
The number of building permits for new housing are well below 2019 levels. (Source: HUD)
The full report can be downloaded here.
These excerpts were compiled and edited in good faith, but may contain errors and subject to revision. Readers are encouraged to review the complete report, which also includes other statistics and insights.
San Francisco Median House Price Changes
Year-over-Year Change in Annual Median House Sales Price

Partial year data for 2021 should be considered preliminary until full-year data is available.
This analysis reflects approximate year-to-year median dollar price changes for houses. On a percentage basis, the 2021 YTD change was 9%, far below the 29% increase in 2000 (dotcom peak). The condo median sales price was basically flat from 2020 to 2021 YTD.
Data through 2020 per the California Associations of Realtors for existing single family dwellings; 2021 an estimate using NorCal Regional MLS data. Data deemed reliable but may contain errors and subject to revision. All numbers are approximate. Changes in median sales prices are not perfect reflections of fair market value.
San Francisco Market Snapshot
Statistics by Property Type, Q2 2021*

Sales reported to NorCal Regional MLS. Median values and statistics fluctuate for a variety of reasons. Data from sources deemed reliable, but may contain errors and subject to revision. Sq.ft. & $/sq.ft. figures calculated on sales which report square footage. Low sales volumes, such as seen in the co-op market make statistics less reliable. 2-4 unit buildings refer to residential multi-family properties. Late reported sales may alter these figures. Numbers are approximate. ** Condo statistics do not include new-project condo listings or sales unreported to MLS. *** Active listings posted to NorCal Regional MLS as of 6/21/21, include listings categorized as "Coming soon.”
San Francisco House Price Appreciation
Median House Sales Prices, 2012 — Present, by Quarter

Seasonal fluctuations are common, and it's not unusual for median sales prices to peak for the year in spring (Q2). Longer-term trends are more meaningful than short-term changes.
Median sales price is that price at which half the sales occurred for more and half for less. It is a very general statistic that can be affected by other factors besides changes in fair market value. All numbers are approximate and subject to revision. Last quarter may change with late reported sales.
San Francisco, Spring 2021 House Sales
A Sampling of San Francisco's 70+ Neighborhoods

Many SF neighborhoods had too few sales for reliable analysis.
* Sales reported to NorCal Regional MLS, March—mid-June 2021. Median values fluctuate for a variety of reasons. Data from sources deemed reliable, but may contain errors and subject to revision. Sq.ft. & $/sq.ft. figures calculated on sales which report square footage. Late reported sales may alter these figures. All numbers approximate.
San Francisco Condo Price Appreciation
Median Condo Sales Prices, 2012 — Present, by Quarter

Seasonal fluctuations are common. Longer-term trends are more meaningful than short-term changes.
As reported to NorCal Regional MLS, per Infosparks. Median sales price is that price at which half the sales occurred for more and half for less. It is a very general statistic that can be affected by other factors besides changes in fair market value. All numbers are approximate and subject to revision. Last quarter may change with late reported activity.
San Francisco, Spring 2021, 2-Bedroom/2-Bath Condo Sales*
A Sampling of San Francisco's 70+ Neighborhoods

All things being equal, a smaller unit will typically sell for a higher dollar per square foot value. Units on higher floors usually sell for higher, often much higher, values.
* Sales reported to NorCal Regional MLS, March — mid-June 2021: not all sales are reported. Many SF neighborhoods had too few sales for reliable analysis. Realtor districts (D1, D5, D7, etc.) often include other neighborhoods adjacent to those listed. Median values often fluctuate due to a variety of factors. Late reported sales may alter these figures. Not all sales report square footage. Data from sources deemed reliable, but may contain errors and subject to revision. All numbers are approximate.
San Francisco Home Sales
6 Months Sales by Price Segment*
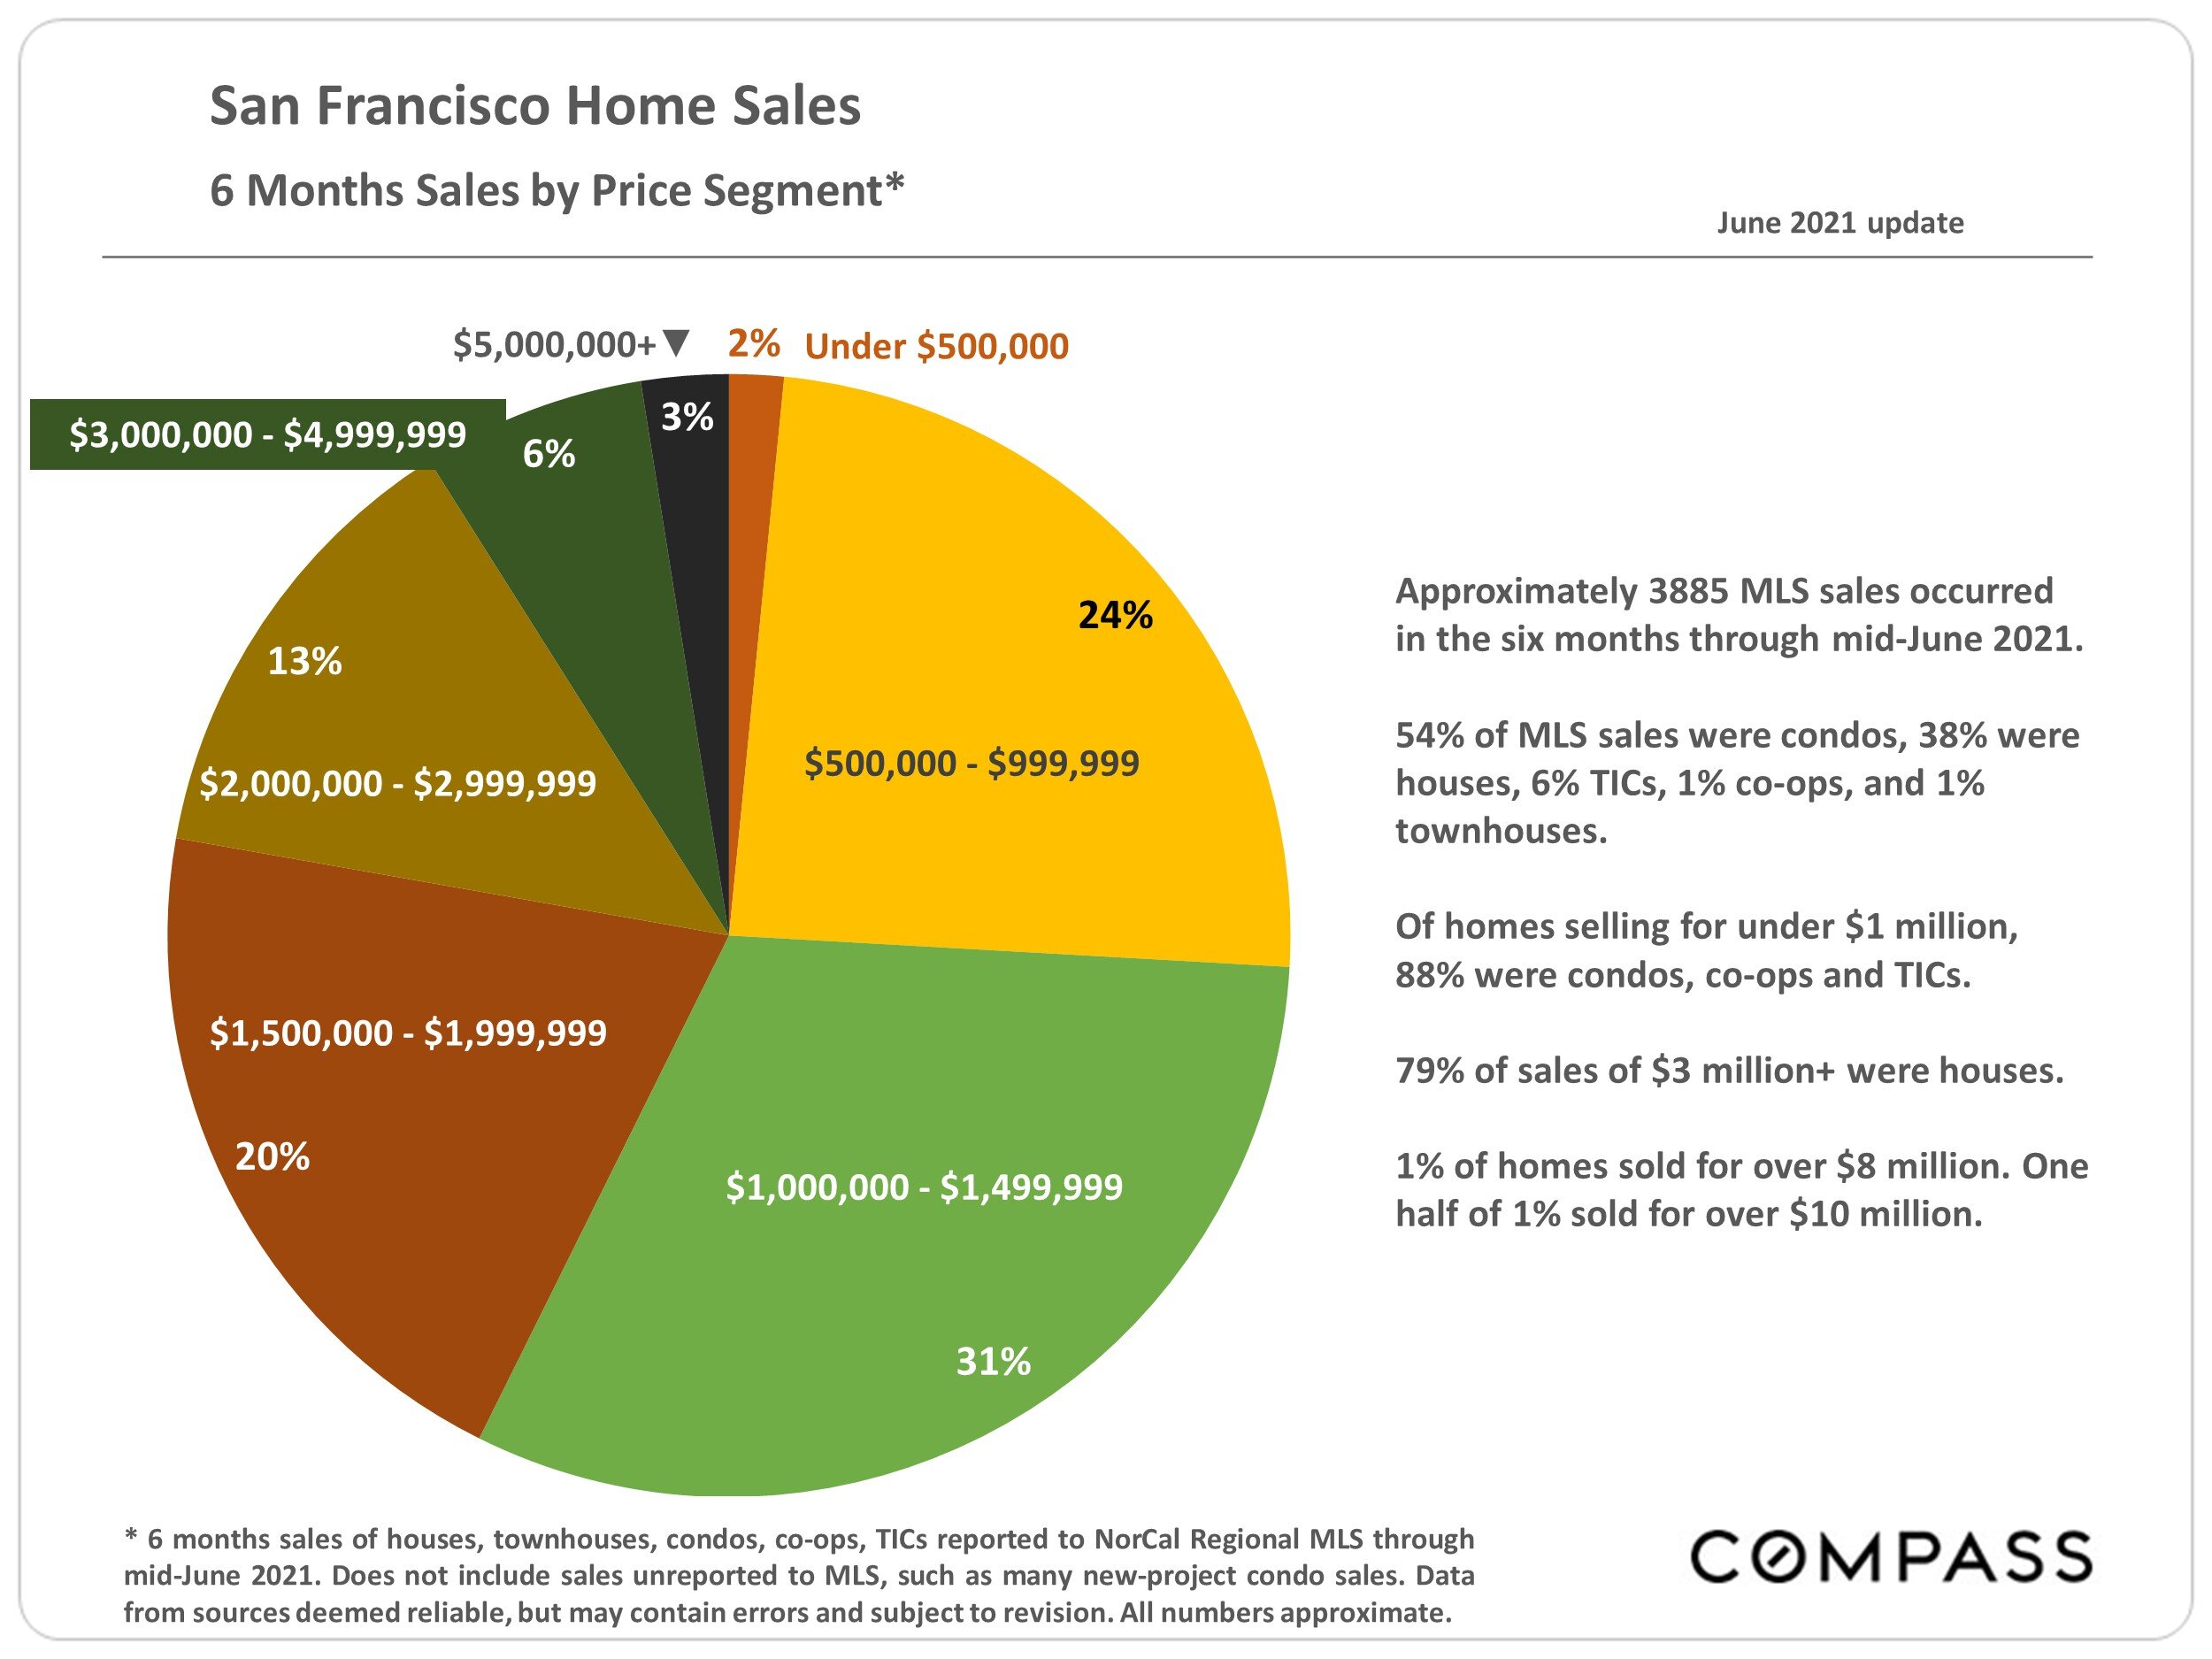
Approximately 3885 MLS sales occurred in the six months through mid-June 2021.
54% of MLS sales were condos, 38% were houses, 6% TICs, 1% co-ops, and 1% townhouses.
Of homes selling for under $1 million, 88% were condos, co-ops and TICs.
79% of sales of $3 million+ were houses.
1% of homes sold for over $8 million. One half of 1% sold for over $10 million.
* 6 months sales of houses, townhouses, condos, co-ops, TICs reported to NorCal Regional MLS through mid-June 2021. Does not include sales unreported to MLS, such as many new-project condo sales. Data from sources deemed reliable, but may contain errors and subject to revision. All numbers approximate.
New Listings Coming on Market
San Francisco Market Dynamics & Seasonality

Per Realtor.com Research: https://www.realtor.com/research/data/, listings posted on site. Data from sources deemed reliable, but may contain errors and subject to revision. All numbers should be considered approximate.
Active Listings on Market
San Francisco Real Estate Market Dynamics

This is a snapshot measure of how many active listings can be expected on any given day of the specified month. This number is affected by 2 major dynamics: 1) how many new listings come on market, and 2) how quickly buyers purchase them. This metric is typically affected by seasonal factors.
San Francisco Market Dynamics & Seasonality
Listings Accepting Offers (Going into Contract) by Month
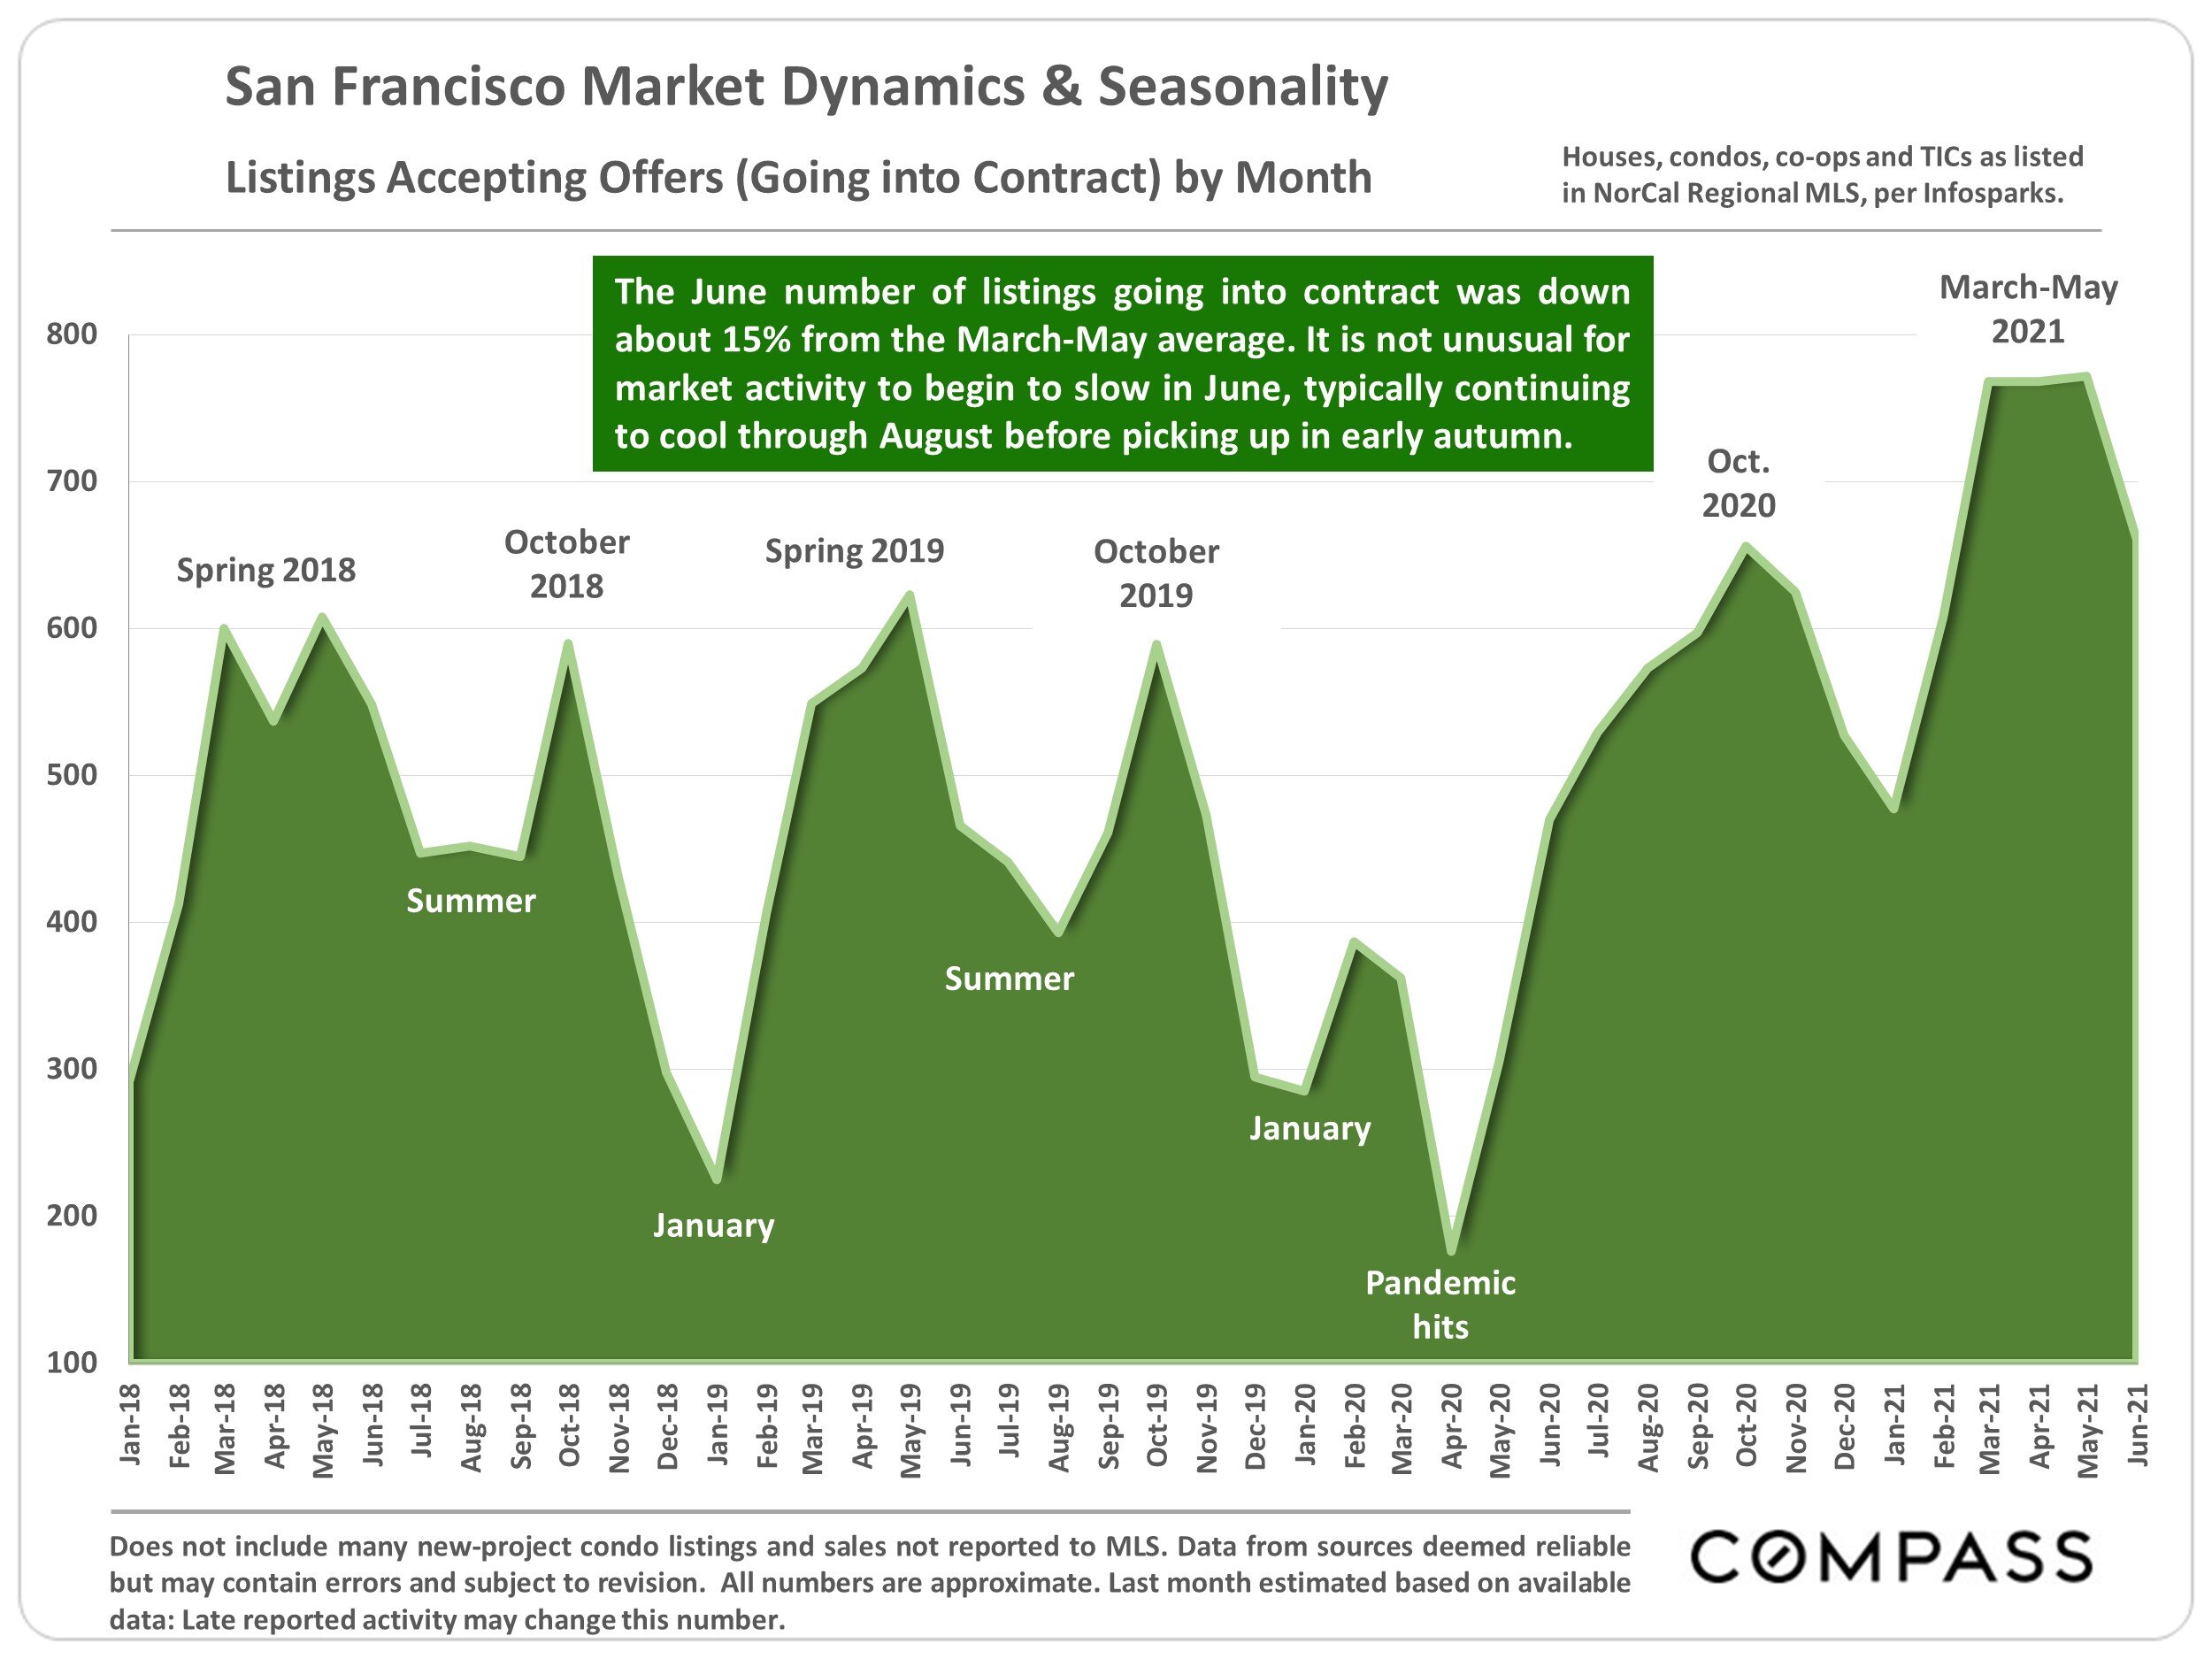
The June number of listings going into contract was down about 15% from the March-May average. It is not unusual for market activity to begin to slow in June, typically continuing to cool through August before picking up in early autumn.
Does not include many new-project condo listings and sales not reported to MLS. Data from sources deemed reliable but may contain errors and subject to revision. All numbers are approximate. Last month estimated based on available data: Late reported activity may change this number.
Unit House Sales by Month since 2018
San Francisco Market Dynamics & Seasonality

Closed sales are a lagging indicator: Sales closing in one month generally reflect accepted offers in the previous month. Spring 2021 sales volume ran well above seasonal norms. Condo sales hit an all-time high.
Activity reported to NorCal Regional MLS, per Infosparks. Data from sources deemed reliable but may contain errors and subject to revision. All numbers are approximate. Last month numbers estimated based on available data.
Percentage of Listings Accepting Offers by Quarter
San Francisco Market Dynamics since 2016

The higher the percentage of listings accepting offers (going into contract), the stronger the buyer demand as compared to the supply of listings for sale.
Residential market activity reported to SFARMLS, per Broker Metrics. Data from sources deemed reliable, but may contain errors and subject to revision. All numbers are approximate. Late reported activity may alter the number of the last period.
San Francisco Market Supply & Demand
Months Supply of Inventory (MSI), January 2018 — Present

Months Supply of Inventory (MSI) measures how long it would take to sell the existing inventory of listings for sale at the 12-month-average monthly rate of sale. Lower readings indicate stronger demand as compared to supply. Since autumn 2020, MSI numbers have plunged as demand has soared.
MLS data per Infosparks. Last reading may change with late reported activity. Does not include new-project condo activity unreported to MLS. Data from sources deemed reliable, but may contain errors and subject to revision. All numbers approximate.
San Francisco Luxury HOUSE Sales
Closed Sales Priced $3 Million+, by Month

Luxury house sales hit a dramatic new high in Spring 2021. Luxury home sales have blasted to new peaks in every county in the Bay Area.
As reported to NorCal Regional MLS, per Infosparks. Data from sources deemed reliable, but may contain errors and subject to revision. All numbers are approximate. Last month data estimated using available data.
San Francisco Luxury House Market
House Sales of $3,000,000+, by District, 12 Months Sales*

There were 21 house sales reported to MLS during the 12-month period with sales prices of $10 million+: 18 of these were in Pacific & Presidio Heights, Cow Hollow and Marina (District 7).
The highest priced house sale reported to MLS during the 12-month period was in Presidio Heights at $24,950,000. The second highest was in Sea Cliff at $24,000,000.
* 12 months sales reported to NorCal Regional MLS through mid-June 2021. Not all luxury home sales are reported to MLS. Neighborhood groupings correspond to SF Realtor districts, which often include adjacent neighborhoods not listed. Data from sources deemed reliable but may contain errors and subject to revision. All numbers approximate.
San Francisco Luxury CONDO Sales*
Closed Sales Priced $2 Million & Above, by Month

Luxury condo, co-op and TIC sales hit a new high in Spring 2021. As reported to NorCal Regional MLS, per Infosparks. Data from sources deemed reliable, but may contain errors and subject to revision. All numbers are approximate. Last month data estimated using available data.
San Francisco Luxury Condo, Co-op & TIC Market
Sales Prices of $2 Million+, by District, 12 Months Sales*

373 of these MLS sales were of condos, 27 were TICs, and 23 were co-ops
The highest priced sale reported to MLS during the 12-month period was a co-op for $14,500,000 in Pacific Heights.
As of mid-June 2021, the following active/coming-soon listings were posted to MLS: 85 at prices $2,000,000 to $2,999,999; 53 at $3,000,000 to $4,999,999; 28 at $5,000,000 to $9,999,999; and 4 at $10 million+. The highest priced MLS listing was a co-op in Pacific Heights for $25 million. (Does not include new-project condos not listed in MLS.)
Unit Sales by Price Segment * 12 months sales reported to NorCal Regional MLS through mid-June 2021 — many new luxury condo projects do not report all listings & sales. Neighborhood groupings correspond to SF Realtor districts, which include other neighborhoods. Data from sources deemed reliable but may contain errors and subject to revision. All numbers approximate.
Sales Price to List Price Differences, Spring 2021 Sales*
San Francisco Home Sales Accepting Offers within 30 Days

Green bars reflect selected condo markets. Blue bars reflect selected house markets.
Illustrating average % differences between sales and list prices on homes which sold relatively quickly — i.e. went into contract within 30 days of coming on market. 10% = an average sales price 10% above list price.
Overbidding typically occurs when buyers compete to purchase new listings. Houses are generally seeing more overbidding than condos, but the condo market heated up rapidly in 2021
Strategic underpricing of new listings by agents and sellers can also be a factor in this statistic.
Sales reported to NorCal Regional MLS, March — mid-June 2021: not all sales are reported. Data from sources deemed reliable, but may contain errors and subject to revision. All numbers are approximate.
Percentage of Homes Selling Quickly, Spring 2021 Sales*
San Francisco Home Sales Accepting Offers within 30 Days

Green bars reflect selected condo markets. Blue bars reflect selected house markets. Illustrating the percentage of home sales that went into contract within 30 days of coming on market. Higher percentages reflect higher demand. Many of these percentages are extremely high on a historical basis.
* Sales reported to NorCal Regional MLS, March — mid-June 2021: not all sales are reported. Data from sources deemed reliable, but may contain errors and subject to revision. All numbers are approximate.
San Francisco Employment Trends
Number of Employed Residents since 2000

According to CA EDD, San Francisco employment numbers dropped by approximately 92,000 (16%) in the immediate impact of the pandemic, but then recovered 37,500 jobs through May 2021. EDD estimates that the civilian labor force — the number of residents able to work, not the number employed — is currently down by about 40,000 (7%) since early 2020, which suggests some decline in population (probably predominantly relocated tenants).
EDD data. Last month's data is labeled "preliminary" by EDD. EDD often goes back to revise past data releases. Data from sources deemed reliable but may contain errors and subject to revision. All numbers should be considered approximate.
Statistics are generalities, essentially summaries of widely disparate data generated by dozens, hundreds or thousands of unique, individual sales occurring within different time periods. They are best seen not as precise measurements, but as broad, comparative indicators, with reasonable margins of error. Anomalous fluctuations in statistics are not uncommon, especially in smaller, expensive market segments. Last period data should be considered estimates that may change with late-reported data. Different analytics programs sometimes define statistics — such as "active listings," "days on market," and "months supply of inventory" — differently: what is most meaningful are not specific calculations but the trends they illustrate. Most listing and sales data derives from the local or regional multi-listing service (MLS) of the area specified in the analysis, but not all listings or sales are reported to MLS and these won't be reflected in the data. "Homes" signifies real-property, single-household housing units: houses, condos, co-ops, townhouses, duets and TICs (but not mobile homes), as applicable to each market. City/town names refer specifically to the named cities and towns, unless otherwise delineated. Multi-county metro areas will be specified as such. Data from sources deemed reliable, but may contain errors and subject to revision. All numbers to be considered approximate.
Many aspects of value cannot be adequately reflected in median and average statistics: curb appeal, age, condition, amenities, views, lot size, quality of outdoor space, "bonus" rooms, additional parking, quality of location within the neighborhood, and so on. How any of these statistics apply to any particular home is unknown without a specific comparative market analysis. Median Sales Price is that price at which half the properties sold for more and half for less. It may be affected by seasonality, "unusual" events, or changes in inventory and buying trends, as well as by changes in fair market value. The median sales price for an area will often conceal an enormous variety of sales prices in the underlying individual sales.
Dollar per Square Foot is based upon the home's interior living space and does not include garages, unfinished attics and basements, rooms built without permit, patios, decks or yards (though all those can add value to a home). These figures are usually derived from appraisals or tax records, but are sometimes unreliable (especially for older homes) or unreported altogether. The calculation can only be made on those home sales that reported square footage.
Compass is a real estate broker licensed by the State of California, DRE 01527235. Equal Housing Opportunity. This report has been prepared solely for information purposes. The information herein is based on or derived from information generally available to the public and/or from sources believed to be reliable. No representation or warranty can be given with respect to the accuracy or completeness of the information. Compass disclaims any and all liability relating to this report, including without limitation any express or implied representations or warranties for statements contained in, and omissions from, the report. Nothing contained herein is intended to be or should be read as any regulatory, legal, tax, accounting or other advice and Compass does not provide such advice. All opinions are subject to change without notice. Compass makes no representation regarding the accuracy of any statements regarding any references to the laws, statutes or regulations of any state are those of the author(s). Past performance is no guarantee of future results.