January 2022 Market Report

Photo by David Abercrombie on Flickr, via Creative Commons
San Francisco Real Estate, 2017 -2021
Year-over-Year Comparisons: Selected Market Indicators
Statistic | 2017 | 2018 | 2019 | 2020 | 2021 |
Median House S.P. | $1,380,000 | $1,520,000 | $1,550,000 | $1,605,000 | $1,800,000 |
Avg. House $/Sq.Ft. | $911/sq.ft. | $975 | $999/sq.ft. | $1006/sq.ft. | $1088/sq.ft. |
Median Condo S.P. | $1,125,000 | $1,180,000 | $1,205,000 | $1,191,000 | $1,225,000 |
Avg. Condo $/Sq.Ft. | $1049/sq.ft. | $1119 | $1145/sq.ft. | $1084/sq.ft. | $1120/sq.ft. |
Median TIC Sales Price | $1,025,000 | $1,095,000 | $1,160,000 | $1,170,000 | $1,050,000 |
Avg. Days on Market* | House: 27 days Condo: 37 days | House: 23 days Condo: 32 days | House: 26 days Condo: 36 days | House: 27 days Condo: 43 days | House: 22 days Condo: 43 days |
% of Sales into Contract within 30 days* | House: 73% Condo: 59% | House: 77% Condo: 64% | House: 74% Condo: 63% | House: 71% Condo: 48% | House: 80% Condo*: 54% |
# of Home Sales* | House: 2522 Condo: 3027 | House: 2516 Condo: 3186 | House: 2459 Condo: 3012 | House: 2472 Condo: 2896 | House: 3075 Condo*: 4590 |
Dollar Volume Sales | $8.25 billion | $8.93 billion | $8.83 billion | $8.78 billion | $13.55 billion |
Sales, $3 Million+ | 330 sales | 354 sales | 377 sales | 390 sales | 766 sales |
Sales, $5 Million+ | 80 sales | 75 sales | 84 sales | 71 sales | 203 sales |
Listings and sales reported to NORCAL MLS® ALLIANCE per Infosparks. Does not include new-project condo activity unreported to MLS. Houses, condos, townhouses, co-ops, TICs unless specified otherwise. *In these categories, “condo” includes co-ops, townhouses and TICs. Data from sources deemed reliable, but may contain errors and subject to revision. 2021 numbers estimated from available data. All numbers approximate, and may change with late-reported activity.
San Francisco Median House Price Changes Since 1994
Annual % Change, Comparing Annual Median Sales Prices to Previous Year

Per CA Association of Realtors or sales data as reported to NORCAL MLS® ALLIANCE. Data from sources deemed reliable but may contain errors and subject to revision. All numbers are approximate.
San Francisco House Price Trends
Median House Sales Prices, 2012 – Present, by Quarter

As reported to NORCAL MLS® ALLIANCE, per Broker Metrics/Infosparks
Seasonal fluctuations are common, and it’s not unusual for median sales prices to peak for the year in spring (Q2). Longer-term trends are more meaningful than short-term changes. Median sales price is that price at which half the sales occurred for more and half for less. It is a very general statistic that can be affected by other factors besides changes in fair market value. All numbers are approximate and subject to revision. Last quarter may change with late reported sales.
San Francisco Condo Price Appreciation
Median Condo Sales Prices, 2012 – Present, by Quarter

As reported to NORCAL MLS® ALLIANCE, per Infosparks
Median sales price is that price at which half the sales occurred for more and half for less. It is a very general statistic that can be affected by other factors besides changes in fair market value. All numbers are approximate and subject to revision. Last quarter may change with late reported activity. Does not include new-project condo sales unreported to MLS. Seasonal fluctuations are common. Longer-term trends are more meaningful than short-term changes.
Home Sales Volumes, Longer-Term Trends since 2005
San Francisco, 12-Month Rolling Sales Data*

* Each data point reflects the total of 12 months of activity for houses, condos, co-ops, TICs and townhouses. 1/12 of these numbers = an average month within the 12 month period. Sales reported to NORCAL MLS® ALLIANCE, per Infosparks. Does not include new-project condo sales unreported to MLS. Last month estimated from data available in early January 2022. Data from sources deemed reliable, but may contain errors and subject to revision. All numbers approximate.
2021 saw the highest 12-month sales volume in at least 16 years. 12-month rolling data delivers broad, clear, long-term trend lines, but may disguise and lag shorter term changes.
San Francisco House Sales Statistics
July-December 2021 Sales*
Within compilations of sales, gradations in quality of location, construction, condition, amenities, home & lot size are almost infinite.
A Sampling of San Francisco Neighborhoods
Selected San Francisco Neighborhoods | Median House Sales Price | Avg. $ per Square Foot | Avg. Size (Sq.Ft.) | Avg. Days on Market | Sales Price to Orig. LP %* | Highest Sale in Period |
Pacific Heights | $6,422,500 | $1548 | 4429 | 28 | 100% | $14,500,000 |
Lake Street | $4,995,000 | $1297 | 3892 | 10 | 105% | $8,650,000 |
Marina | $4,064,500 | $1562 | 3340 | 17 | 104% | $19,750,000 |
St. Francis Wood | $3,475,000 | $1258 | 3029 | 20 | 111% | $6,650,000 |
Russian, Nob & Tel Hills | $3,387,500 | $1293 | 3155 | 35 | 106% | $9,999,000 |
Cole Valley/Parnassus Heights | $3,372,500 | $1339 | 2798 | 14 | 113% | $6,288,000 |
Hayes Vly, Alamo Sq., NoPa | $2,982,500 | $998 | 3061 | 19 | 104% | $7,830,000 |
Noe Valley | $2,900,000 | $1380 | 2397 | 15 | 113% | $6,300,000 |
Inner Richmond | $2,700,000 | $1107 | 2402 | 14 | 109% | $4,000,000 |
Inner Mission | $2,275,000 | $1082 | 2559 | 21 | 113% | $4,375,000 |
Inner Sunset | $2,217,500 | $1059 | 2266 | 18 | 116% | $4,250,000 |
Bernal Heights | $1,837,500 | $1170 | 1650 | 20 | 119% | $4,275,000 |
Miraloma Park | $1,810,000 | $1082 | 1856 | 19 | 122% | $2,828,000 |
Central Sunset | $1,750,000 | $1069 | 1765 | 15 | 126% | $2,700,000 |
Outer Parkside | $1,600,000 | $1174 | 1435 | 14 | 131% | $2,450,000 |
Ingleside | $1,400,000 | $901 | 1667 | 18 | 122% | $2,040,000 |
Excelsior | $1,250,000 | $896 | 1470 | 19 | 121% | $1,935,000 |
Bayview | $950,000 | $687 | 1521 | 30 | 117% | $1,400,000 |
See home values in all SF neighborhoods.
*Sales reported to NORCAL MLS® ALLIANCE, 7/1-12/15/21. Sales price to LP % for sales which accepted offers within 30 days. Data from sources deemed reliable but may contain errors and subject to revision. All numbers approximate and can change on a daily basis. Not all listings provide square footage. Days on market adjusted for outliers.
San Francisco Condo Sales Statistics
July-December 2021 Sales*
Within compilations of sales, gradations in quality of location, construction, condition, amenities, home & lot size are almost infinite.
A Sampling of San Francisco Neighborhoods
Selected San Francisco Neighborhoods | Median Condo Sales Price | Avg. $ per Sq.Ft. | Avg. Size (Sq.Ft.) | Avg. Days on Market | Sales Price to Orig. LP %* | Highest Condo Sale in Period |
Presidio Heights | $2,520,000 | $1309 | 1945 | 19 | 108% | $5,250,000 |
Lake St./Jordan Park | $1,850,000 | $1121 | 1674 | 15 | 111% | $3,400,000 |
Russian Hill | $1,695,000 | $1241 | 1497 | 25 | 104% | $4,050,000 |
Cow Hollow | $1,672,000 | $1448 | 1215 | 30 | 105% | $7,375,000 |
Pacific Heights | $1,662,500 | $1313 | 1500 | 23 | 105% | $6,100,000 |
Noe-Eureka-Cole Valleys | $1,525,000 | $1181 | 1359 | 18 | 112% | $3,700,000 |
Inner Sunset | $1,425,000 | $995 | 1458 | 19 | 125% | $2,125,000 |
Central-Inner Richmond | $1,335,000 | $1074 | 1236 | 19 | 116% | $2,010,000 |
Hayes Vly, NoPa, Alamo Sq. | $1,350,000 | $1169 | 1282 | 28 | 112% | $3,250,000 |
Dogpatch | $1,265,000 | $1068 | 1279 | 22 | 104% | $1,675,000 |
Mission Bay | $1,250,000 | $1158 | 1144 | 41 | 101% | $3,080,000 |
South Beach | $1,249,000 | $1289 | 1181 | 50 | 100% | $9,000,000 |
Inner Mission | $1,200,000 | $1082 | 1150 | 30 | 110% | $2,400,000 |
Potrero Hill | $1,172,000 | $1066 | 1220 | 31 | 109% | $2,625,000 |
Van Ness/Civic Center | $885,000 | $999 | 967 | 47 | 102% | $3,200,000 |
South of Market (SoMa) | $834,500 | $861 | 1022 | 62 | 104% | $1,750,000 |
Bayview/Crocker Amazon | $810,000 | $754 | 1114 | 42 | 112% | $1,100,000 |
See home values in all SF neighborhoods.
*Sales of 1+ BR units reported to NORCAL MLS® ALLIANCE, 7/1-12/15/21. Sales price to LP % for sales accepting offers within 30 days. Data from sources deemed reliable but may contain errors and subject to revision. Numbers are approximate and can change on a daily basis. Not all listings provide square footage. Days on market adjusted for outliers.
San Francisco: 2+ Bedroom Home Sales
2021 Sales by Price Segment & Bedroom Count*

* 12 months MLS sales of houses, townhouses, condos, co-ops and TICs through late December 2021, per Broker Metrics. Data derived from sources deemed reliable, but may contain errors and subject to revision.All numbers approximate. Not all sales are reported to MLS.
The high volume of 2-bedroom home sales mostly reflects the city’s large condo market. More condos sell than all the other property types – houses, co-ops, townhouses and TICs – combined. Not reflected on chart: Approx. 1430 studio and 1-bedroom home sales, mostly condos. 77% of these sold for under $1,000,000. 10% of home sales were for $3,000,000+. 2.6% were for $5,000,000+. Less than ½ of 1% sold for $10,000,000+.
California Association of Realtors® 2021 CA Housing Market Survey - Highlights
61% of CA homes sold above asking price, the highest % in at least 30 years. Both the share of sales with multiple offers and the average number of offers received reached their highest levels since 2013. 2021 saw the shortest time-on-market to offer acceptance in 35 years. 60% of accepted offers were non-contingent (not subject to appraisal, financing, inspections, etc.). 20% of buyers paid all cash.
Most CA REALTORS® noticed at least one of the following changes in buyer preferences since the pandemic: Opting for bigger home (22%); less concerned about commute (22%); buying house instead of condo/townhome (21%); opting for suburban instead of city location (19%); choosing rural instead of urban or suburban location (13%)
29% of CA sellers planned to buy again in same county (lowest % in at least 16 years); 35% planned to buy in another state (highest % in at least 16 years)
Primary reason to move out of home county: Housing affordability (26%), quality of life (15%), closer to family (12%), 2nd home (12%), commute (6%), retirement (6%), ability to work from home (5%)
Single most important reason to buy: 1st time buyers - tired of renting (56%); repeat buyers - larger home (23%), better location (20%), investment or taxes (13%)
Vacation/2nd home sales reached highest level in 9 years: 7% of sales. Homes purchased for investment/rental: 9.5%. Sales to international buyers hit highest % since 2014: 5% of sales.
Housing affordability – the % of CA households able to afford median priced house – hit its lowest percentage since 2008 (despite historically low interest rates): 23% - 24% in Q2 & Q3 2021.
Survey sent to a random sample of 39,567 CA REALTORS®, geographically distributed across state. 1,908 valid survey responses = response rate of 4.8%. Margin of error for survey was +/- 2.2% at a 95% confidence level.
County Population Changes
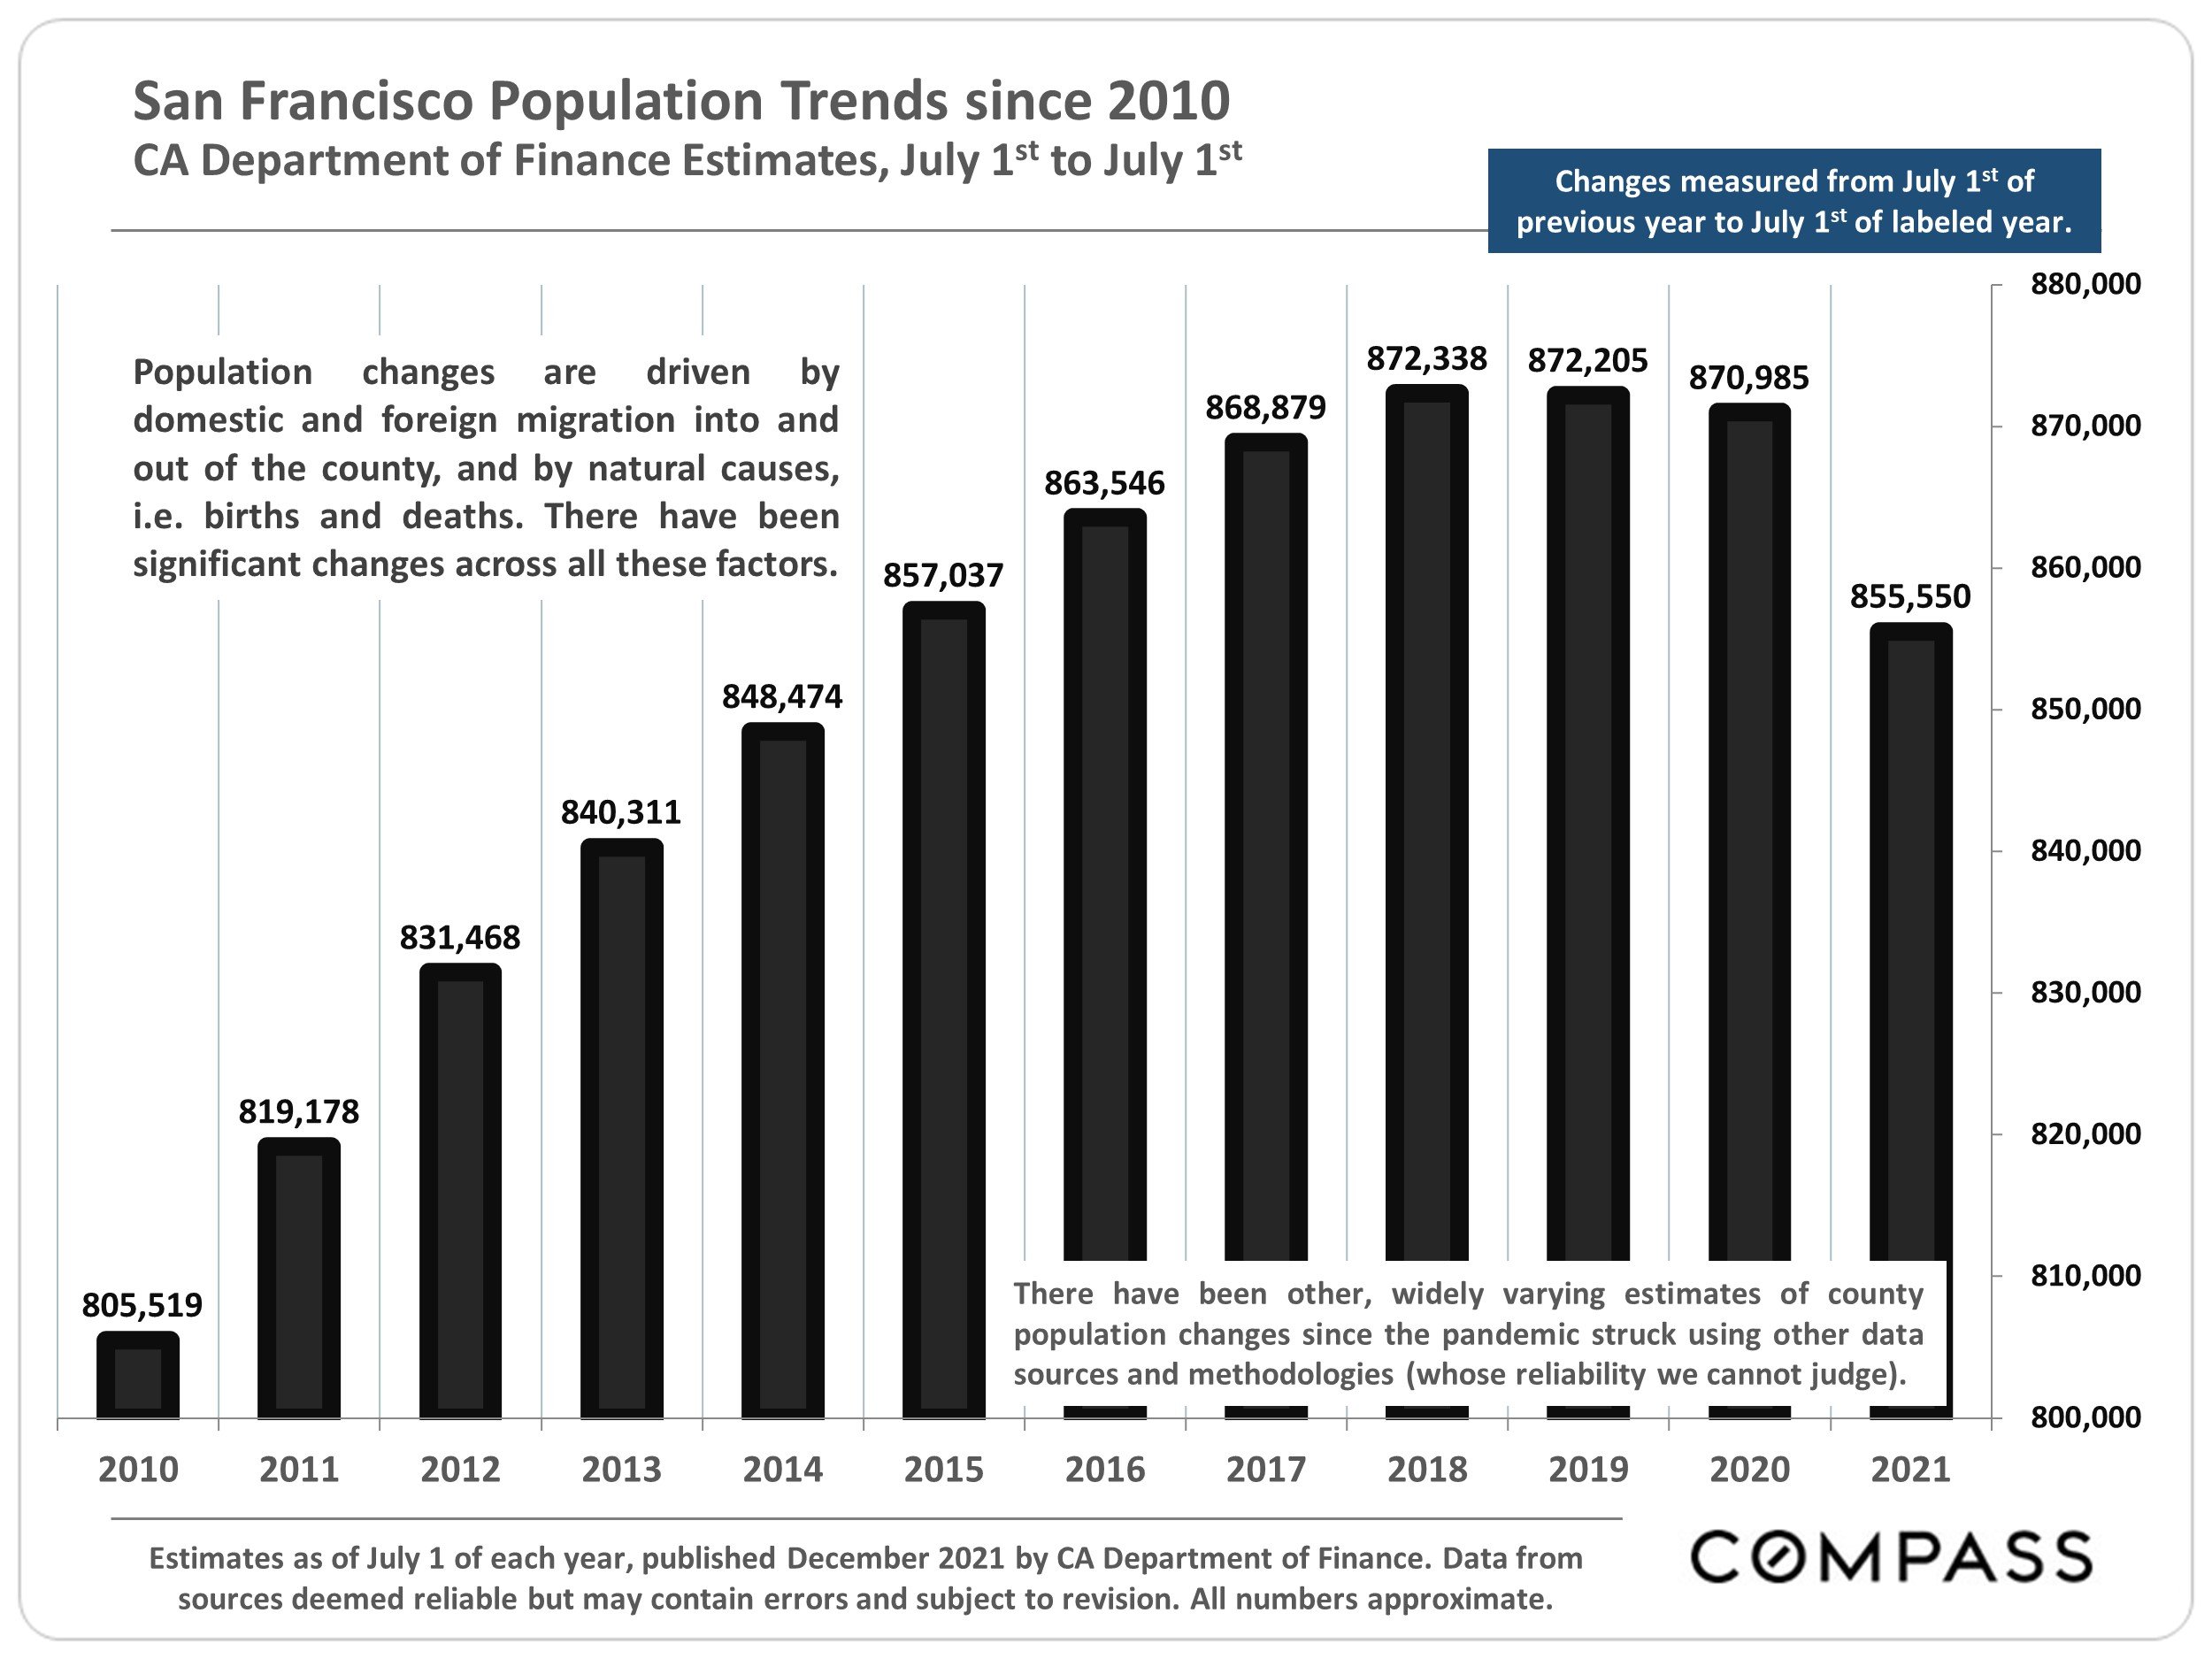
Changes measured from July 1 of the previous year to July 1 of the labeled year, as published December 2021 by the CA Department of Finance. Data from sources deemed reliable but may contain errors and subject to revision. All numbers approximate.
Since 2019, the county population has declined by 2%. Populations dropped in almost every Bay Area County since the pandemic hit, but SF saw the largest percentage decline. This decline was probably dominated by tenant move-outs.

Over the period, the number of births in the county dropped by 8%, and the number of deaths increased by 16%, resulting in a 55% decline in population increase due to natural causes.
Domestic & Foreign Migration


Changes measured from July 1 of the previous year to July 1 of the labeled year, as published December 2021 by the CA Department of Finance. Data from sources deemed reliable but may contain errors and subject to revision. All numbers approximate.
Since 2019, net domestic out-migration – the difference between the number of residents moving out to other U.S. locations and people moving into the county from other U.S. locations – increased by 126%. Within the city, recent, net domestic out-migration was probably most concentrated in the tenant population, one reason rents have dropped significantly since Covid struck.
Over the period, net foreign in-migration – the difference between the number of people moving into the county from abroad and county residents moving out to foreign countries – dropped by 83%.
Both trends, generally common across the Bay Area – increased domestic out-migration and declining foreign in-migration – go back to 2016 or earlier.
San Francisco Luxury Home Sales since 2018
Houses - $3 Million+, Condos - $2 Million+, by Quarter
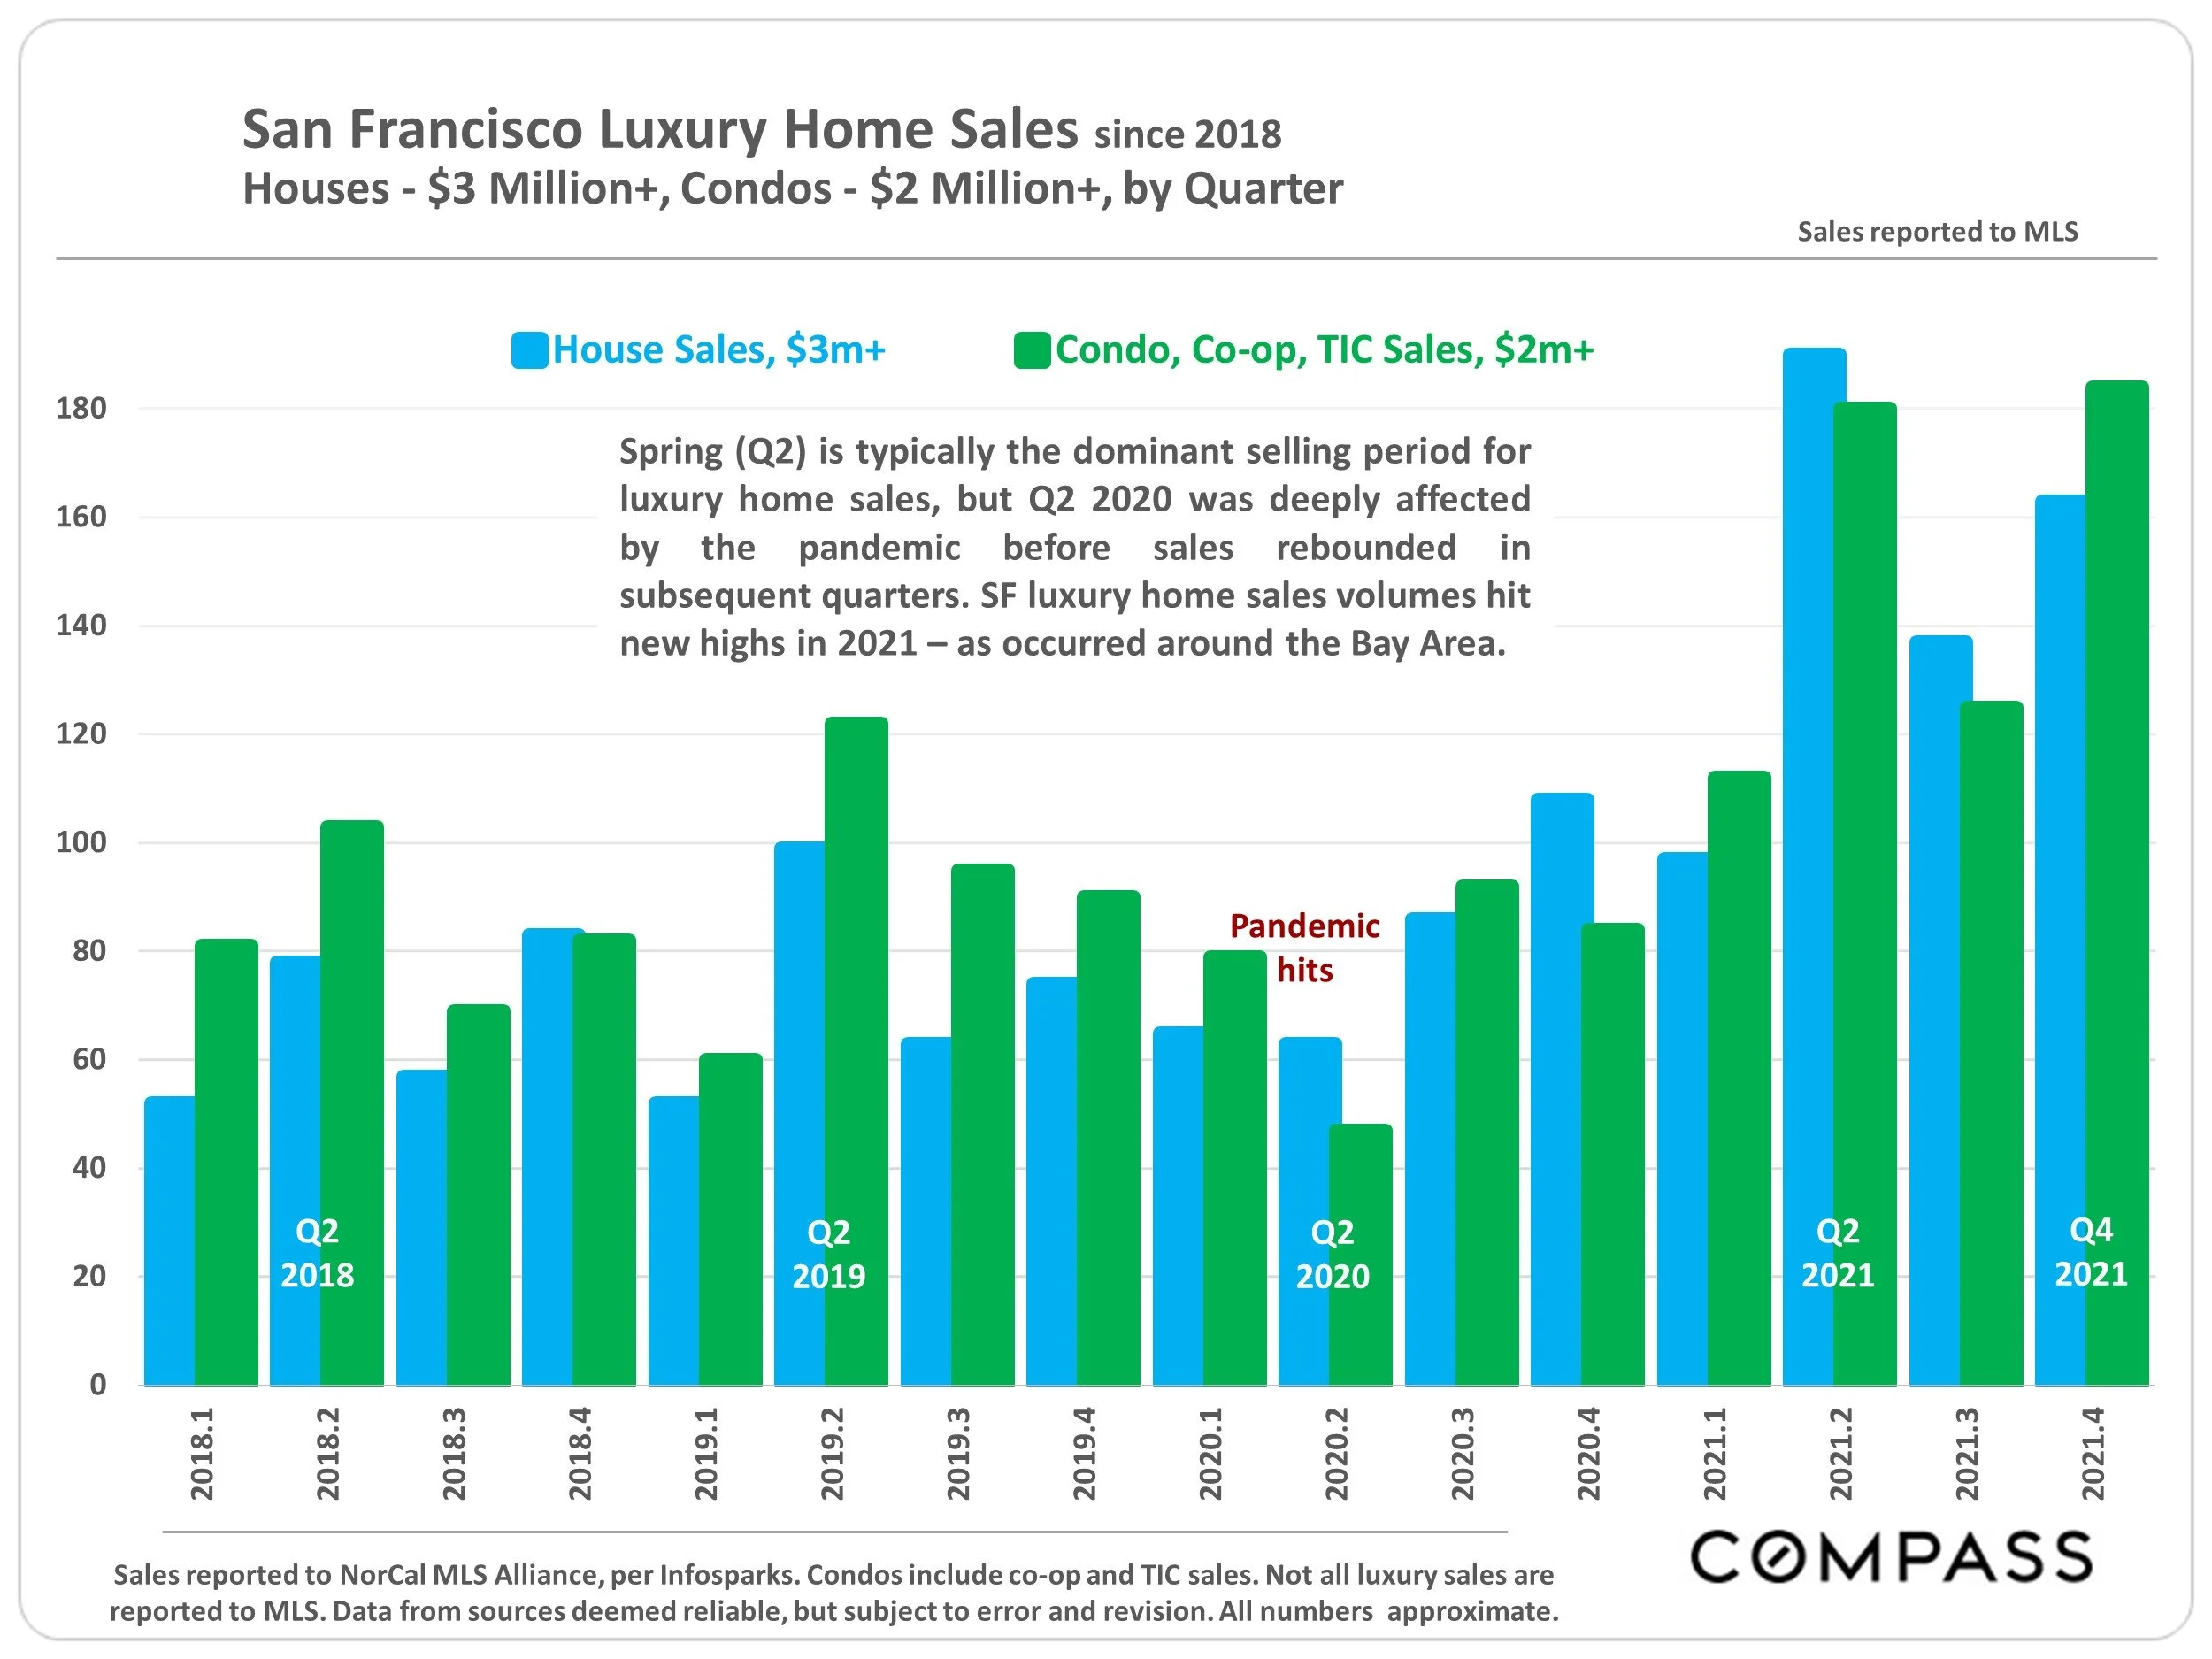
Sales reported to NorCal MLS Alliance, per Infosparks. Condos include co-op and TIC sales. Not all luxury sales are reported to MLS. Data from sources deemed reliable, but subject to error and revision. All numbers approximate.
Spring (Q2) is typically the dominant selling period for luxury home sales, but Q2 2020 was deeply affected by the pandemic before sales rebounded in subsequent quarters. SF luxury home sales volumes hit new highs in 2021 – as occurred around the Bay Area.
Avg. Sales Price to Original List Price Percentage (SP/LP %)
San Francisco Market Dynamics since 2018, by Quarter

Residential market activity reported to NORCAL MLS® ALLIANCE, per Infosparks. Data from sources deemed reliable, but may contain errors and subject to revision. All numbers are approximate, and may change with late-reported sales.
100% signifies an average sales price at original list price. After first dropping when the pandemic hit, overbidding and the SP/LP % for both houses and condos climbed in 2021 – however, overbidding for houses remains much higher.
Months Supply of Inventory (MSI)
San Francisco Real Estate Market since 2016
Rolling 3-month average, activity reported to NorCal MLS Alliance per Infosparks
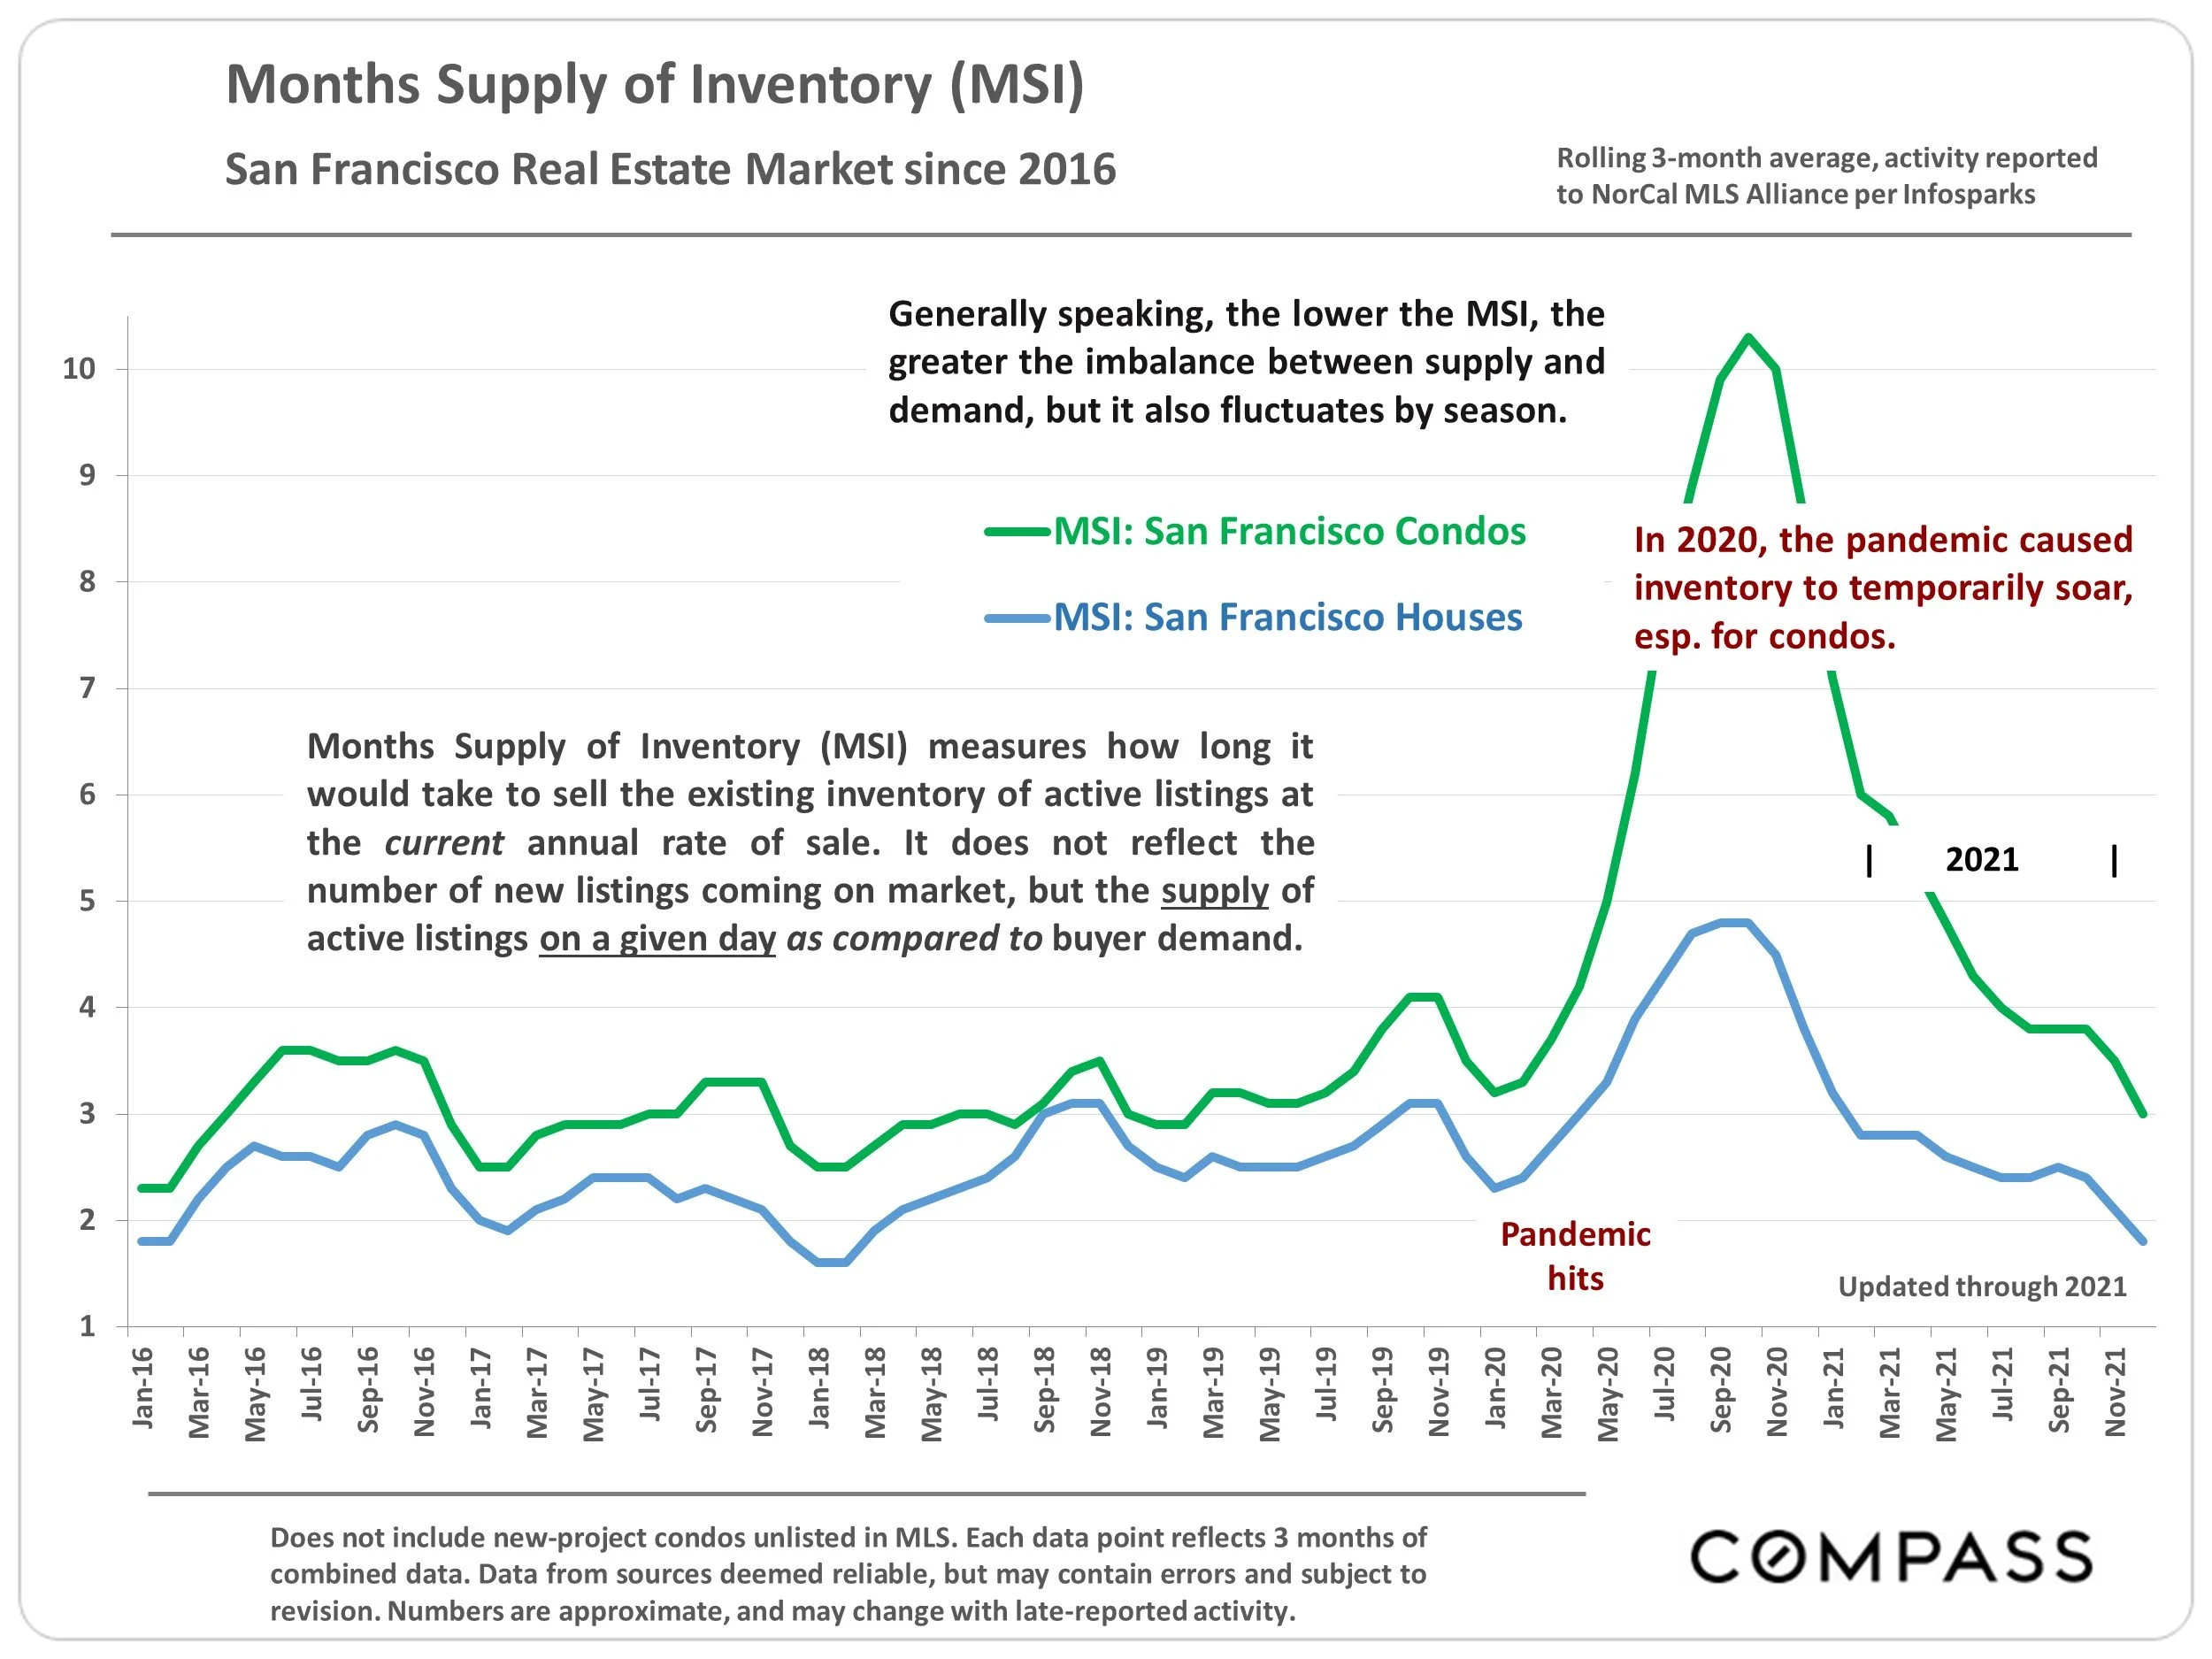
Does not include new-project condos unlisted in MLS. Each data point reflects 3 months of combined data. Data from sources deemed reliable, but may contain errors and subject to revision. Numbers are approximate, and may change with late-reported activity.
Generally speaking, the lower the MSI, the greater the imbalance between supply and demand, but it also fluctuates by season. Months Supply of Inventory (MSI) measures how long it would take to sell the existing inventory of active listings at the current annual rate of sale. It does not reflect the number of new listings coming on market, but the supply of active listings on a given day as compared to buyer demand. In 2020, the pandemic caused inventory to temporarily soar, esp. for condos.
Average Days on Market by Quarter
San Francisco Market Dynamics since 2019

Activity reported to NORCAL MLS® ALLIANCE, per Infosparks. “Condos” include co-op and TIC sales. Data from sources deemed reliable, but may contain errors and subject to revision. All numbers approximate, and may change with late- reported sales.
On average, houses continue to go into contract much more quickly than condos, co-ops and TICs, but the market heated up for all these property types in 2021.
San Francisco Residential Rents – Approximate, Good Faith Estimates*
Average Asking Rent, 1994 – Present, Q1 Data Points (except as noted)

1st quarter data points except, as noted for Q4 2020 and Q4 2021. Numbers are estimated using data from a number of rental data sources. Data from sources deemed reliable but may contain errors and subject to revision. All numbers are good-faith estimates and very approximate.
SF Rents bounced back in 2021 from the post-pandemic 25%+ plunge in 2020, but dropped a little again since September 2021. Rents are now down about 14% since before the pandemic (and, not illustrated here, down 10% in Oakland & 6% in San Jose). 11/29/21 Apartment List, National Rent Report *
* Due to the different methodologies used to calculate these numbers, plus free-rent and other incentives, these are very general estimates of overall trends in rent rates. Different sources quote varying numbers: As of 12/2021. Socketsite estimates rents are 19% below early 2020.
Inflation & Mortgage Interest Rates
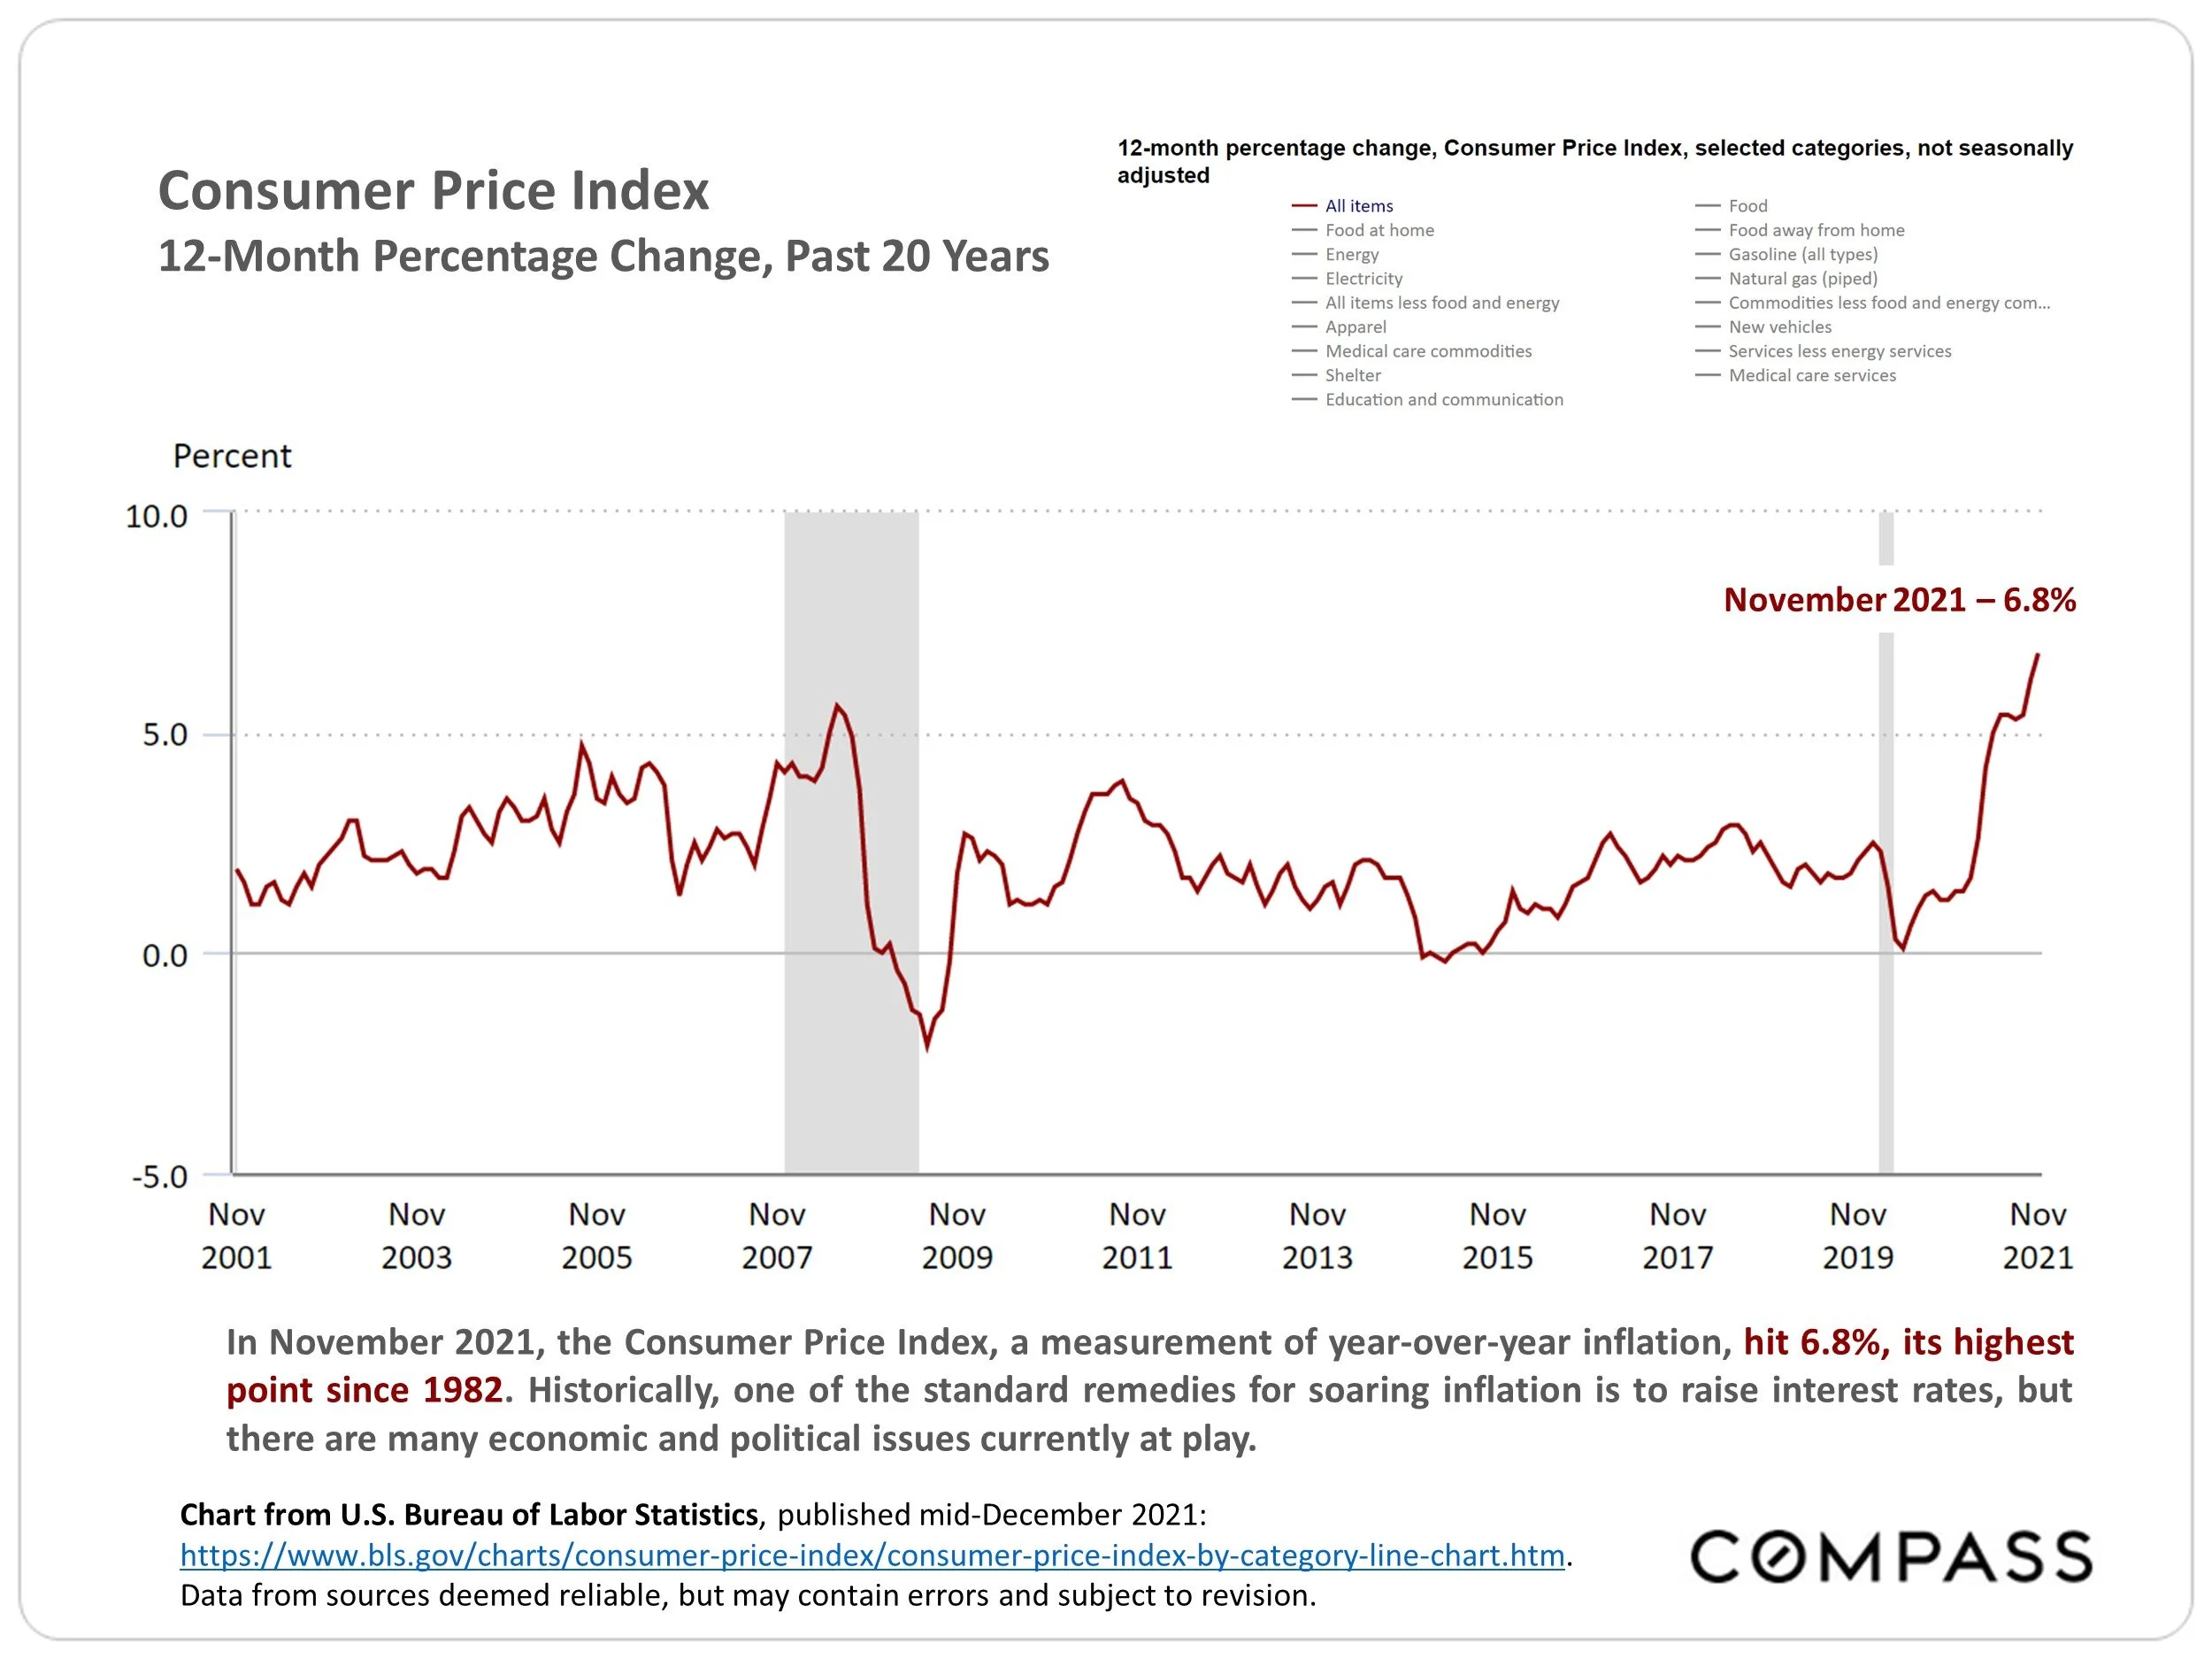
The Consumer Price Index, a measurement of year-over-year inflation, soared in 2021 to hit 6.8%, its highest point since 1982.
Historically, the standard remedy for surging inflation is to raise interest rates, but there are a variety of economic and political factors currently at play.

Per Freddie Mac (FHLMC), on December 30, 2021, the weekly average, 30-year mortgage interest rate was 3.11%. The all-time low of 2.65% was reached earlier in the year, in January 2021.
Freddie Mac currently forecasts an average annual 30-year interest rate of 3.5% for 2022, but, historically, interest rate predictions have often been unreliable.
Interest rates may fluctuate suddenly and dramatically, and it is very difficult to accurately predict rate changes. Data from sources deemed reliable, but may contain errors and not guaranteed. Provided for informational purposes only.
San Francisco Employment Trends
Number of Employed Residents since 2000

EDD data. Last month’s data is labeled “preliminary” by EDD. EDD often goes back to revise past data releases. Data from sources deemed reliable but may contain errors and subject to revision. All numbers should be considered approximate. Data from sources deemed reliable, but may contain errors, and not guaranteed. Provided for informational purposes only. All numbers should be considered approximate, and subject to revision.
According to CA EDD, San Francisco employment numbers dropped by approximately 92,000 (16%) in the immediate impact of the pandemic, but then recovered 68,000 jobs through November 2021. The unemployment rate went from 2.2% in February 2020 to 13% in April 2020, and is now 3.3%: Over this period EDD calculates the SF labor force fell by about 18,000 – which correlates with the city’s drop in population since 2019.
S&P 500 Stock Index

From February 2020 – prior to the initial, pandemic-caused market crash – through the end of 2021, the S&P 500 gained 46%.
Since the pandemic, there has been an explosion of new wealth – in cash, financial markets, real estate, and other assets – concentrated in the already affluent. This is the demographic which dominates Bay Area home buying.
U.S. Household Wealth
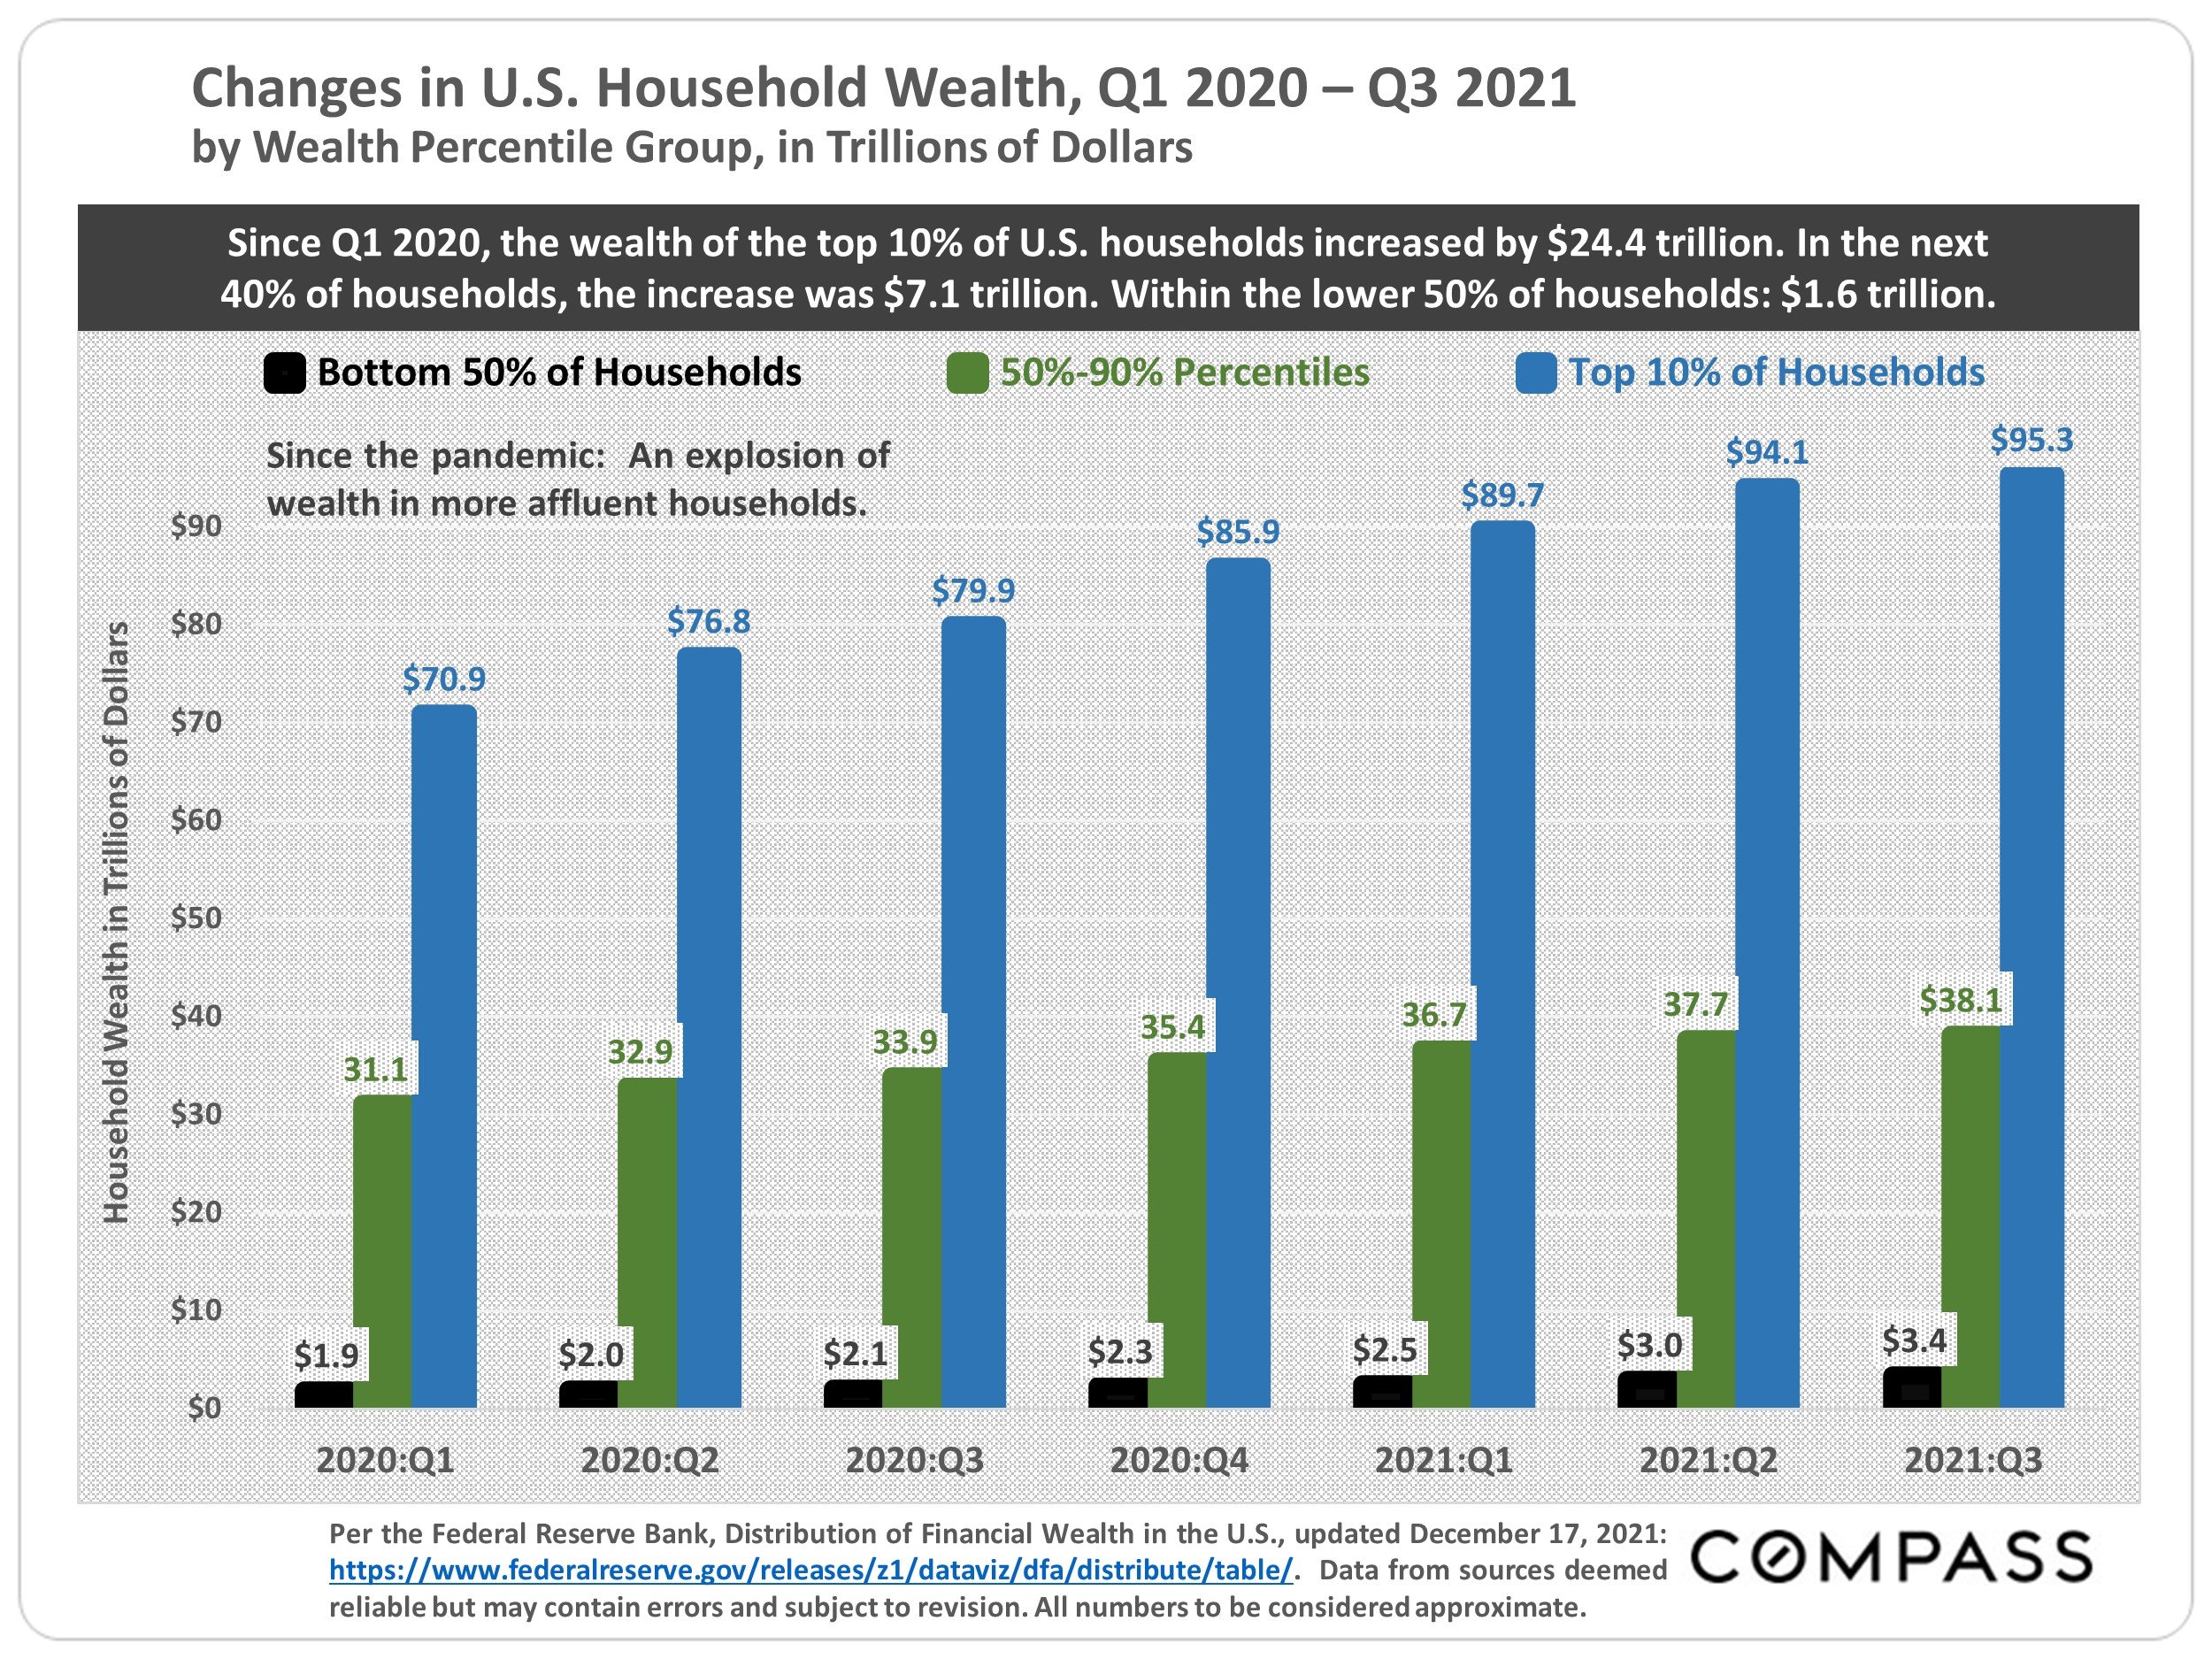
Per the Federal Reserve Bank, from Q4 2019 (before the pandemic struck) to Q3 2021, the wealth of the top 10% of U.S. households skyrocketed by $18.9 trillion to $95.3 trillion. For the next 40% of households, the increase was $6.5 trillion, for a total of $38.1 trillion. And within the lower 50% of households, +
$1.4 trillion, for a new total of $3.4 trillion.
Q4 2021 will presumably show further gains.
Statistics are generalities, essentially summaries of widely disparate data generated by dozens, hundreds or thousands of unique, individual sales occurring within different time periods. They are best seen not as precise measurements, but as broad, comparative indicators, with reasonable margins of error. Anomalous fluctuations in statistics are not uncommon, especially in smaller, expensive market segments. Last period data should be considered estimates that may change with late-reported data. Different analytics programs sometimes define statistics – such as “active listings,” “days on market,” and “months supply of inventory” – differently: what is most meaningful are not specific calculations but the trends they illustrate. Most listing and sales data derives from the local or regional multi-listing service (MLS) of the area specified in the analysis, but not all listings or sales are reported to MLS and these won’t be reflected in the data. “Homes” signifies real-property, single-household housing units: houses, condos, co-ops, townhouses, duets and TICs (but not mobile homes), as applicable to each market. City/town names refer specifically to the named cities and towns, unless otherwise delineated. Multi-county metro areas will be specified as such. Data from sources deemed reliable, but may contain errors and subject to revision. All numbers to be considered approximate.
Many aspects of value cannot be adequately reflected in median and average statistics: curb appeal, age, condition, amenities, views, lot size, quality of outdoor space, “bonus” rooms, additional parking, quality of location within the neighborhood, and so on. How any of these statistics apply to any particular home is unknown without a specific comparative market analysis.
Median Sales Price is that price at which half the properties sold for more and half for less. It may be affected by seasonality, “unusual” events, or changes in inventory and buying trends, as well as by changes in fair market value. The median sales price for an area will often conceal an enormous variety of sales prices in the underlying individual sales.
Dollar per Square Foot is based upon the home’s interior living space and does not include garages, unfinished attics and basements, rooms built without permit, patios, decks or yards (though all those can add value to a home). These figures are usually derived from appraisals or tax records, but are sometimes unreliable (especially for older homes) or unreported altogether. The calculation can only be made on those home sales that reported square footage.
Compass is a real estate broker licensed by the State of California, DRE 01527235. Equal Housing Opportunity. This report has been prepared solely for information purposes. The information herein is based on or derived from information generally available to the public and/or from sources believed to be reliable. No representation or warranty can be given with respect to the accuracy or completeness of the information. Compass disclaims any and all liability relating to this report, including without limitation any express or implied representations or warranties for statements contained in, and omissions from, the report. Nothing contained herein is intended to be or should be read as any regulatory, legal, tax, accounting or other advice and Compass does not provide such advice. All opinions are subject to change without notice. Compass makes no representation regarding the accuracy of any statements regarding any references to the laws, statutes or regulations of any state are those of the author(s). Past performance is no guarantee of future results.