February 2022 Market Report

2021 was one of the most frenzied real estate markets ever, with buyer demand far exceeding the supply of listings available to buy – and all the usual indicators, including home price appreciation trends, reflected this severe imbalance. As is the normal seasonal trend, listing and offer activity dropped substantially mid-November through early January, resulting in very low sales volume in the year’s first month.
As of 2/3/22, mortgage interest rates have risen 14% in 2022, putting them 34% above the low 1 year ago. Inflation is at a 40-year high, and the Fed plans to make major changes to its interest-rate policies and its interventions in the economy generally. Consumer confidence has been dropping, and financial markets have seen considerable turbulence in the new year. Geopolitical risks of major-power conflict appear to be rising.
On the other hand, employment, GDP, and household-wealth indicators are quite positive; by historical standards, interest rates remain very low and stock markets very high; COVID infections are falling. The Bay Area is home to many of the world’s most innovative and successful companies; there is an enormous concentration of local wealth; and a staggering amount of money sloshing around the economy looking for somewhere to invest. Many believe real estate to be an excellent hedge against inflation, and an excellent long-term investment generally (heightened by tax advantages).
In the Bay Area, real estate market indicators remain very strong: demand for homes still very high, inventory still low. So far, buyers do not seem to be significantly rattled by stock market gyrations, and increasing interest rates may be motivating some to buy sooner than later. As the new year wakes up, a common dynamic in heated markets is for buyers to jump back in much faster than sellers: Demand outpaces supply right from the start, with all the usual results (multiple offers, overbidding, fast sales), even as the number of new listings starts climbing. This describes 2022 to date, but more will be known once the spring selling season – typically the biggest of the year – really gets underway. (In the Bay Area, the “spring” market can begin in February.)
As an aside: Compared to the general market, luxury home buyers tend to be less sensitive to interest rate movements, but more sensitive to turbulence and uncertainty in financial markets.
Data from a variety of sources deemed reliable, but may contain errors and subject to revision. Economic indicators and political conditions can change with great rapidity. Many different opinions exist regarding current conditions, and past and future trends among economists, commentators and other analysts.
San Francisco Median Home Sales Prices, 2012-2021
3-Bedroom Houses vs 2-Bedroom Condos, 6-Month Rolling Figures*

Median sales price is that price at which half the sales occurred for more and half for less. It is a very general statistic often affected by factors other than changes in fair market value. Data from sources deemed reliable, but may contain errors and subject to revision. All numbers approximate. Markets vary by city district.
2012 – 2021, the median sales price of 2BR condos went from 10% above the median price of 3BR houses to 15% below. Factors include the construction of thousands of new condos– new house building in SF is virtually nil – as well as issues pertaining to COVID, which may or may not be temporary.
San Francisco Home Sales Breakdown
6 Months Sales by Property Type & Bedroom Count

January 2022 update: 6 months sales reported to NorCal MLS Alliance through 1/21/22. Does not include new-project condo sales unreported to MLS. Based upon data sources deemed reliable, but may contain errors and subject to revision. All numbers should be considered approximate.
Median Sales Prices & Median $/Sq.Ft.
2BR Houses - $1,420,000, $1149/sq.ft.
3BR Houses - $1,800,000, $1099/sq.ft.
4BR Houses - $2,300,000, $1017/sq.ft.
5+BR Houses - $3,052,500, $978/sq.ft.
1BR Condos - $850,000, $1067/sq.ft.
2BR Condos - $1,337,500, $1148/sq.ft.
3BR Condos - $1,820,000, $1104/sq.ft.
4BR Condos - $2,295,000, $1048/sq.ft.
There were also 59 studio condo & co-op sales: Median $499,000, 460 sq.ft., $1100/sq.ft. More 2-BR condos sell in SF than any other property type.
San Francisco Home Sales, 2019-2021* By Bedroom Count
Home Sales Volumes by Year Percentage Increases, 2019-2021

* Sales reported to NorCal MLS Alliance. Data from sources deemed reliable, but may contain errors and subject to revision. Not all sales are reported to MLS: Will not include new-project condo sales unreported to MLS. All numbers are approximate.
Sales volumes are affected by a number of factors, including buyer demand, economic and social factors (COVID, shelter in place, work from home, employment, interest rates, stock markets, home prices), and simply the number of homes available to purchase – the inventory of houses for sale has remained far below the number of condo listings. In San Francisco, percentage increases in the sale of larger condos and houses have been highest.
San Francisco: Supply of Inventory*
Active Listings on 2/1/22

* Active/Coming Soon listings posted to NorCal MLS Alliance, and 12 months sales of MLS listings through 1/20/22. Data from sources deemed reliable, but may contain errors and subject to revision. All numbers approximate. # of active listings changes on daily basis.
Generally speaking, under 2.5 to 3 months of inventory is typically considered a “seller’s market” in SF. As of 2/1/2022, there is a 4-week supply of houses and an 8-week supply of condos. New listing activity typically increases rapidly moving into early spring, but 2022 supply is starting from a low base – especially of house listings. Inventory conditions vary by city district and price segment.
Unsold Inventory Index in Months of Supply of Active Listings
Bay Area House Market, 2000 – 2021, 6-Month Rolling Average*

* 6-month rolling average of California Association of Realtors monthly data for existing single family dwellings, for 9 Bay Area Counties. Not seasonally adjusted; does not include condo Inventory (which would raise the reading). Data from sources deemed reliable, but may contain errors and subject to revision. All numbers approximate.
The CAR Unsold Inventory Index measures how long it would take to sell the current inventory of active house listings at the current rate of sale. The lower the MSI, the stronger the buyer demand as compared to the supply of listings on the market.
Under 3 months of inventory would typically be considered to indicate a sellers’ market. The single month of December 2021 hit the lowest reading on record: .8 month of inventory in the Bay Area.
Like most market statistics, this measurement is subject to seasonal fluctuations, though using a 6-month-rolling average smooths the trend line.
Mortgage Interest Rate Trends, 2016 – Present
30-Year Conforming Fixed-Rate Loans, Weekly Average Readings

Interest rates may fluctuate suddenly and dramatically, and it is very difficult to predict rate changes. Data from sources deemed reliable but not guaranteed. Anyone interested in residential home loans should consult with a qualified mortgage professional and their accountant.
Per Freddie Mac (FHLMC), on February 3, 2022, the weekly average, 30-year interest rate was 3.55%, up from 3.11% on 12/30/21. The all-time low of 2.65% was reached in January 2021. In November 2018, the rate was 4.94%.
Median House AND CONDO Sales Price Trends
Selected San Francisco Neighborhoods, since 2012


Median Sales Price is that price at which half the sales occurred for more and half for less. Multiple neighborhood values through 2020 are averages of median sales prices. Data from sources deemed reliable, but may contain errors and subject to revision. All numbers are approximate and may change with late-reported sales.
New Listings Coming on Market, Long-Term Trends
San Francisco, 12-Month Rolling, MLS Listing Data, since 2005*

* Each data point reflects the TOTAL of 12 months of activity for houses, condos, co-ops and townhouses. 1/12 of these numbers = an average month within the 12 month period. New listings reported to MLS, per NorCal MLS Alliance, per Infosparks. Data from sources deemed reliable, but may contain errors and subject to revision. Numbers are approximate and are meant to illustrate broad trends.
The “low inventory” situation often referred to in market reports does not signify that fewer homes have come on market since the pandemic – indeed, the contrary occurred. It means that due to level of buyer demand and the speed at which listings are selling, there has typically been a very low supply of homes for sale on any given day.
The 12 months through spring 2021 saw the highest 12-month, new-listing volume since 2006. It has dropped significantly since, but is still running much higher than recent years.
12-month rolling data delivers broad, long-term trend lines, but may disguise and lag shorter term changes. These figures will not reflect the approximately 10% to 15% of new listings not posted to MLS, but the chart should still be broadly representative of market trends.
New Listings Coming on Market by Month
San Francisco Market Dynamics & Seasonality
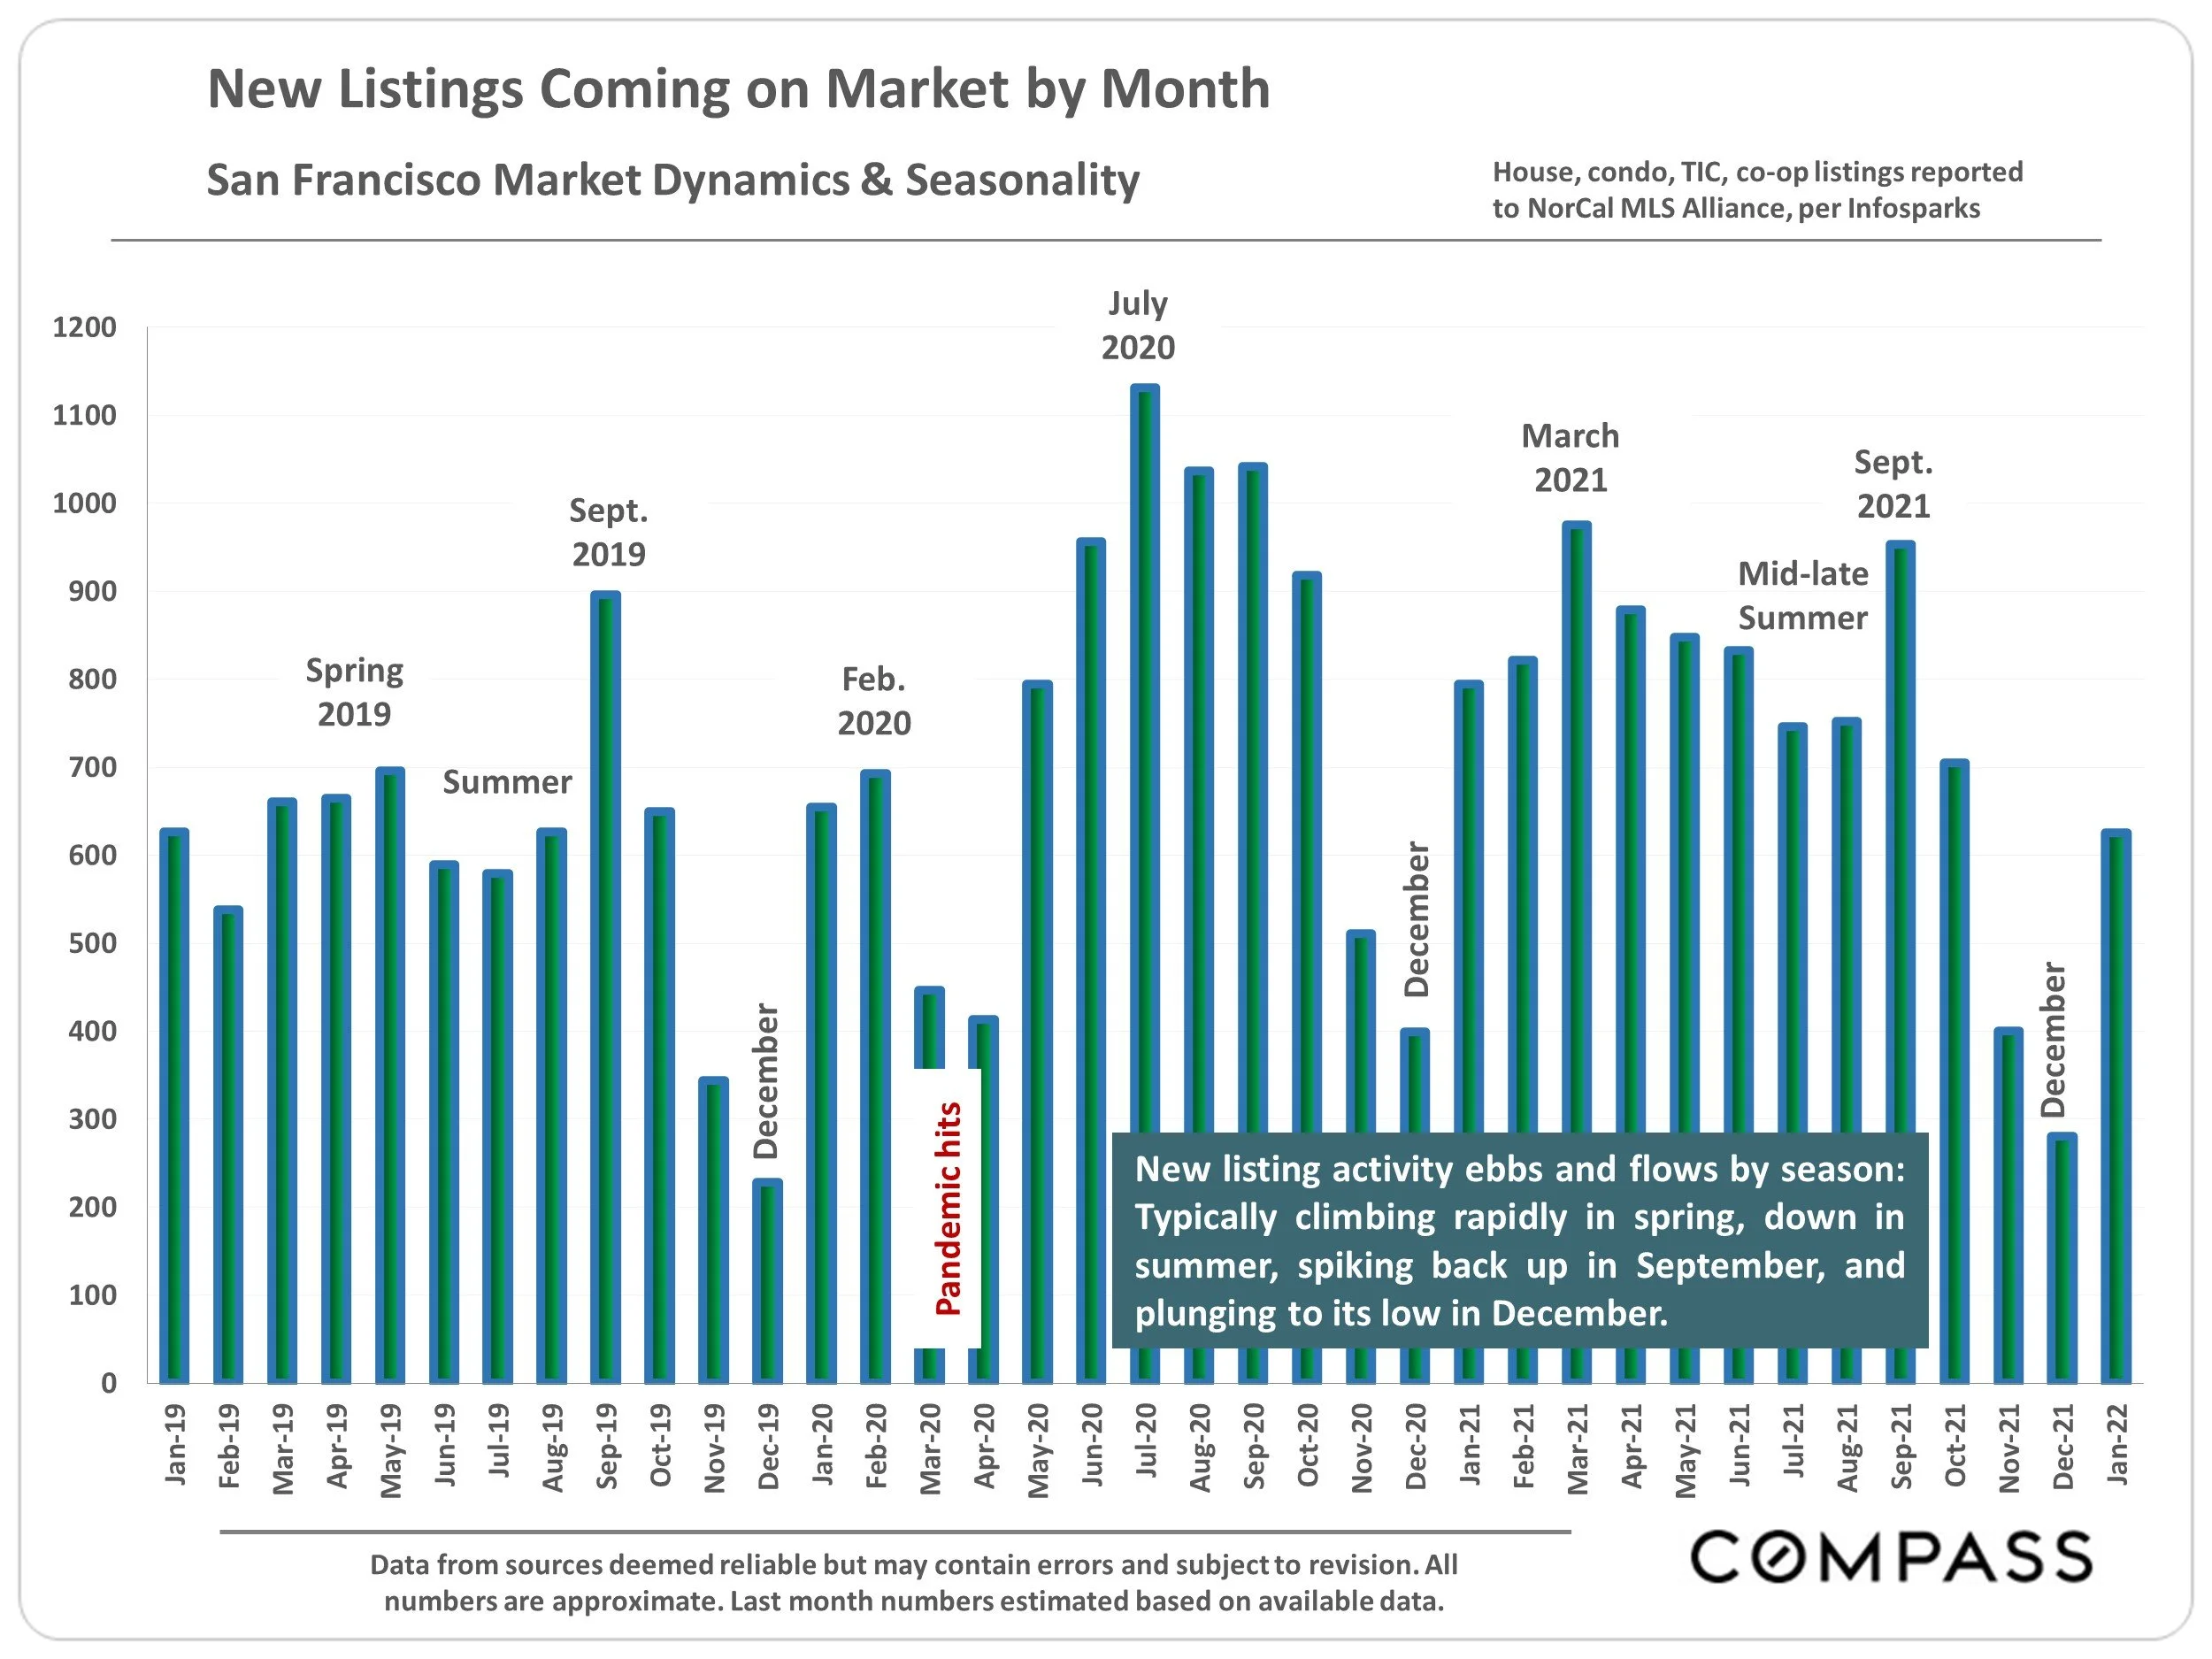
Data from sources deemed reliable but may contain errors and subject to revision. All numbers are approximate. Last month numbers estimated based on available data.
New listing activity ebbs and flows by season: Typically climbing rapidly in spring, down in summer, spiking back up in September, and plunging to its low in December.
Home Sales Volume by Month
San Francisco Market Dynamics & Seasonality

Activity reported to NorCal MLS Alliance, per Infosparks. Data from sources deemed reliable but may contain errors and subject to revision. All numbers are approximate. Last month numbers estimated based on available data.
Sales volume ebbs and flows by season: Up in spring, down in summer, back up in fall, and way down in mid-winter. Sales closing in one month mostly reflect accepted offers in the previous month: January’s low sales reflect the typical December slowdown.
The pandemic upended typical seasonal trends in 2020 – sales peaked in December, an occurrence we’ve never seen before – but 2021 has reverted to the norm.
San Francisco Luxury House Market
House Sales of $4,000,000+, by District, 12 Months Sales*

* 12 months sales reported to NorCal MLS Alliance through 1/20/22. Not all luxury home sales are reported to MLS. Neighborhood groupings correspond to SF Realtor districts, which often include adjacent neighborhoods not listed. Data from sources deemed reliable but may contain errors and subject to revision. All numbers approximate.
There were 21 house sales reported to MLS during the 12-month period at prices of $10 million+: 19 were in Pacific & Presidio Heights, Cow Hollow and Marina (District 7), and 1 each were in Clarendon Heights and Lower Pacific Heights. The highest priced house sale reported during the period was in Cow Hollow at $32,000,000.
San Francisco Luxury Condo, Co-op, Townhouse & TIC Market
Sales Prices of $2.5 Million+, by District, 12 Months Sales*

* 12 months sales reported to NorCal MLS Alliance through 1/20/22. Not all sales are reported to MLS. Neighborhood groupings correspond to SF Realtor districts, which often include adjacent neighborhoods. Data from sources deemed reliable but may contain errors and subject to revision. All numbers approximate.
247 of these sales were condos, 29 co-ops, 13 TICs, and 7 were townhouses. There were 6 sales reported at $10 million & above. The highest sale reported during the 12-month period was a Pacific Heights co-op for $15.5M.
San Francisco Long-Term Luxury Home Sales Trends
12-Month Rolling Sales Volumes since 2011*
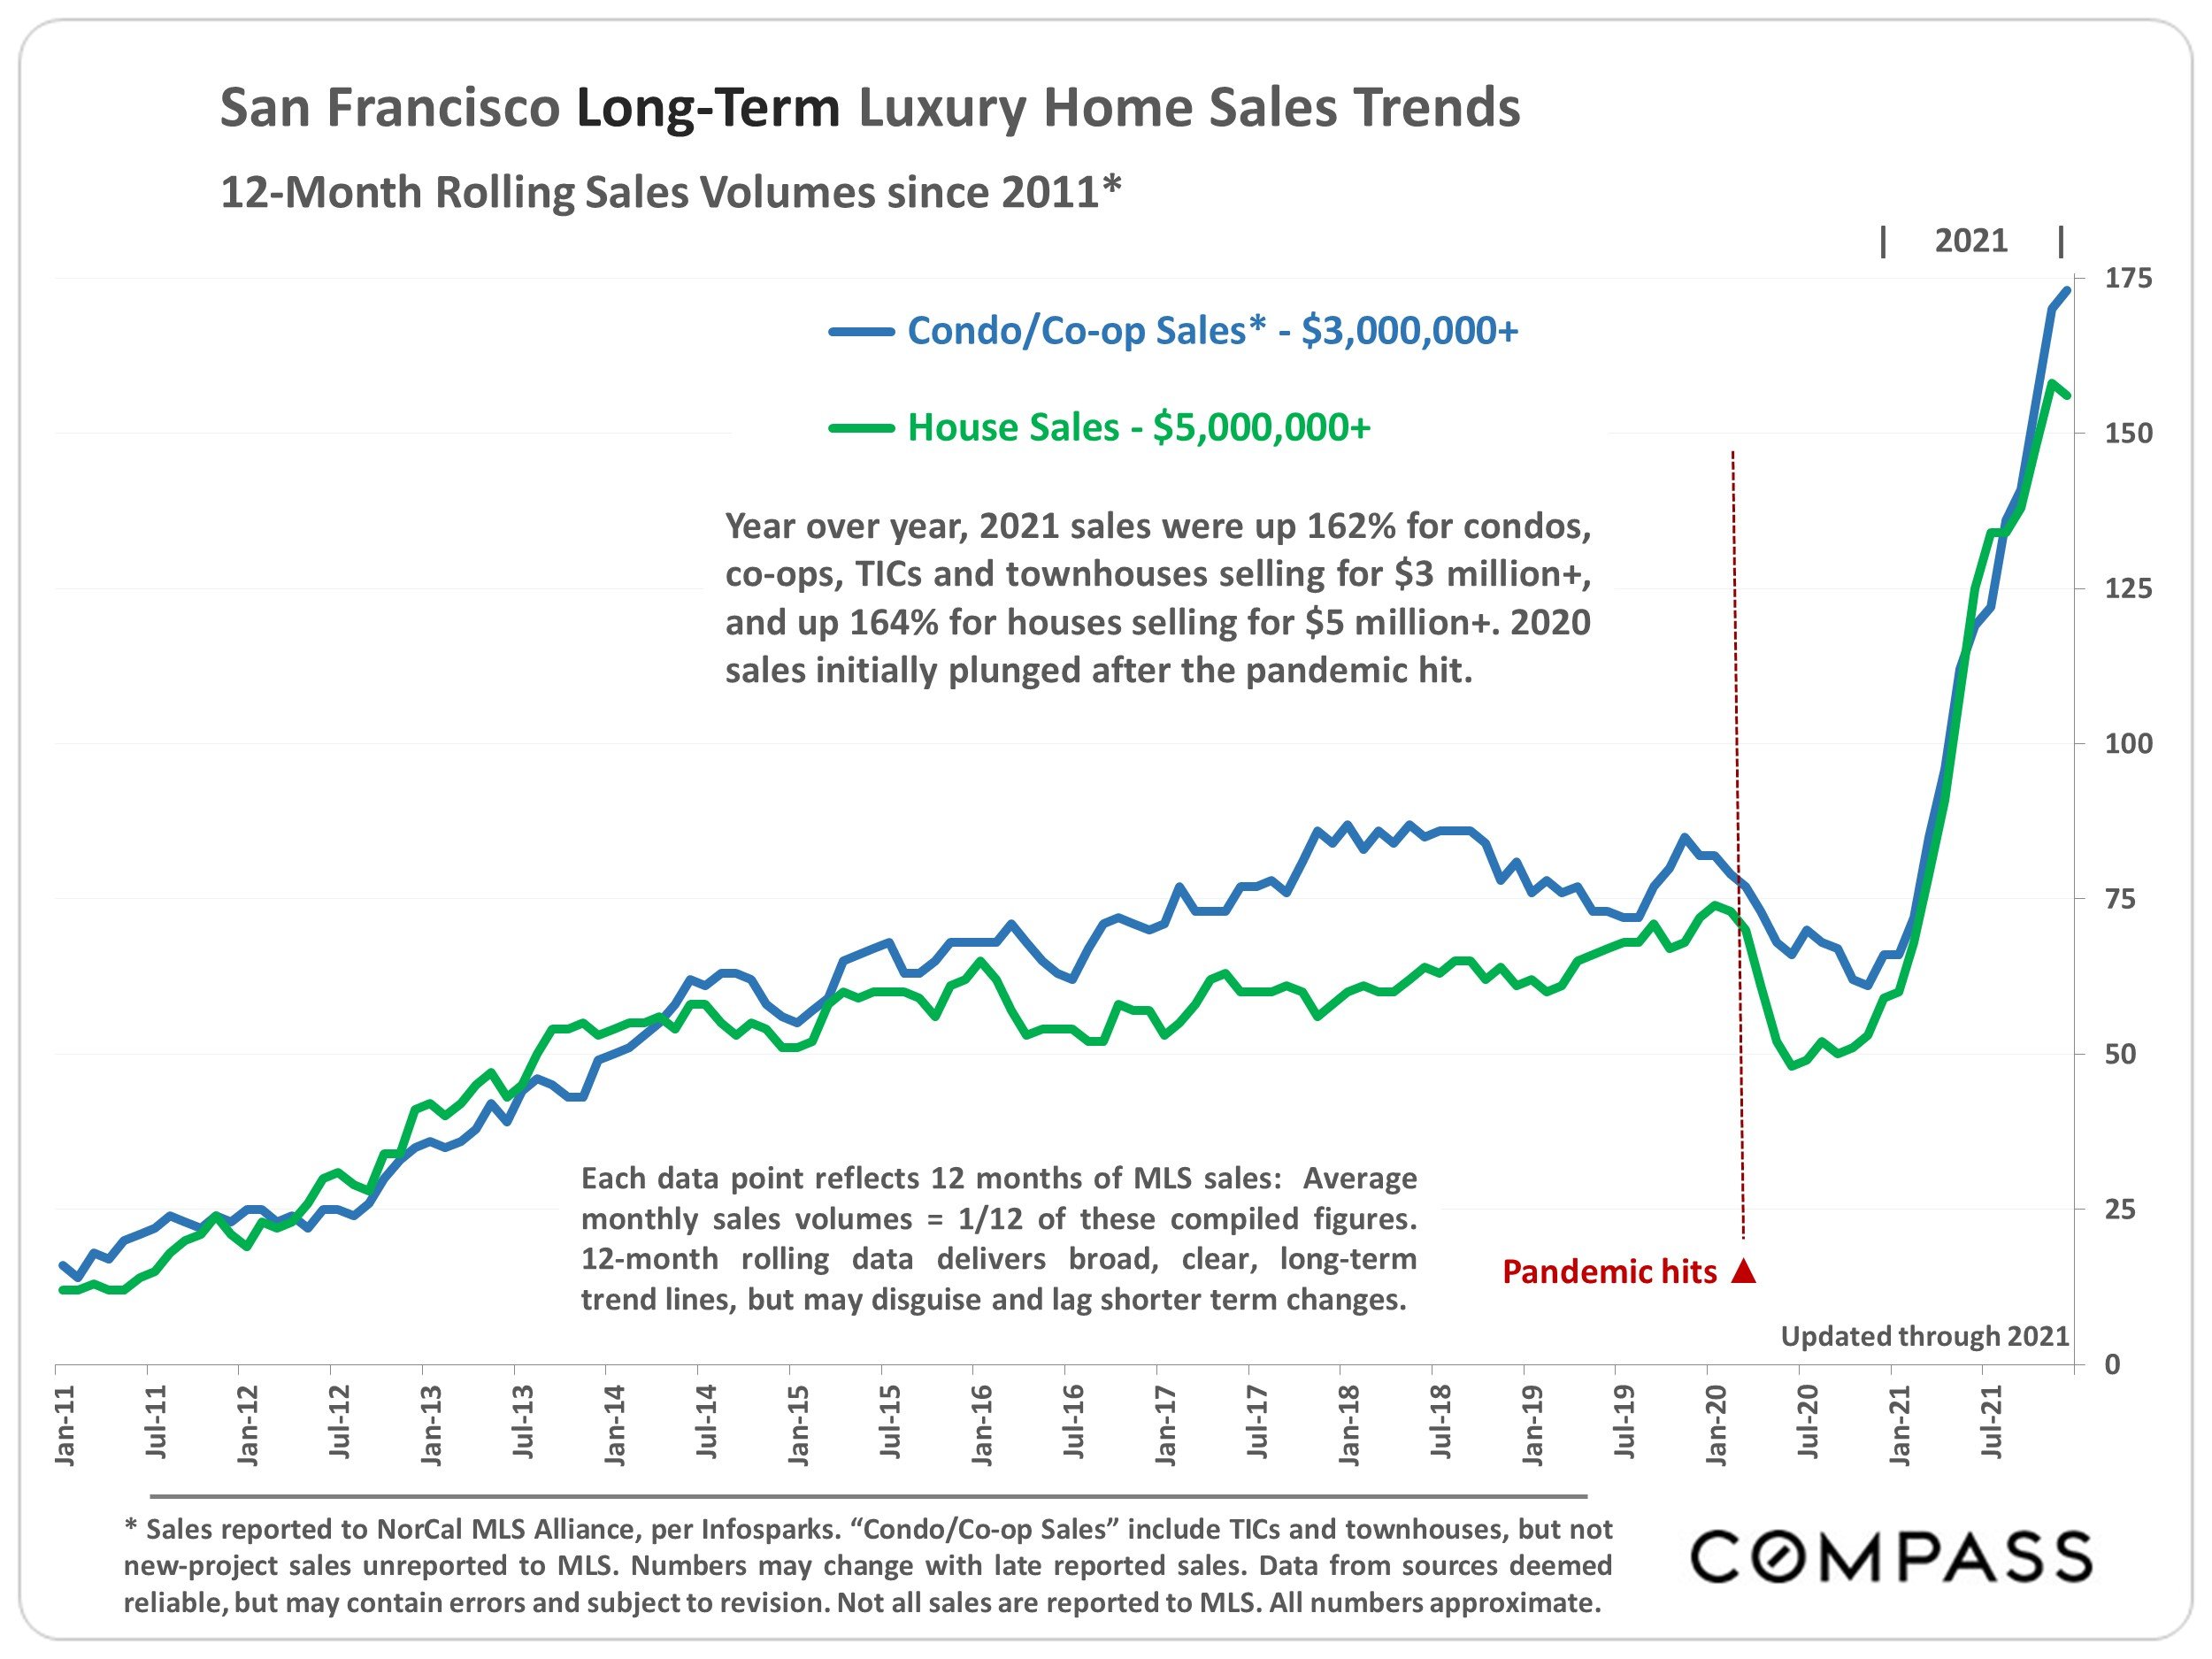
* Sales reported to NorCal MLS Alliance, per Infosparks. “Condo/Co-op Sales” include TICs and townhouses, but not new-project sales unreported to MLS. Numbers may change with late reported sales. Data from sources deemed reliable, but may contain errors and subject to revision. Not all sales are reported to MLS. All numbers approximate.
Year over year, 2021 sales were up 162% for condos, co-ops, TICs and townhouses selling for $3 million+, and up 164% for houses selling for $5 million+. 2020 sales initially plunged after the pandemic hit.
San Francisco Short-Term Luxury Home Sales by Month
Homes Selling for $3 Million+, January 2021 – January 2022

Sales reported to MLS. Data from sources deemed reliable but may contain errors and subject to revision. Last month estimated from available data, and may change with late-reported sales. All numbers approximate.
Closed sales mostly reflect accepted-offer activity in the previous month, i.e. January’s lower sales reflect the big market slowdown in December. The luxury home market typically ebbs and flows by season: Climbing through spring, slowing in summer, spiking up in fall, and plunging in mid-winter.
Average Days on Market
San Francisco: Time on Market to Accepted Offer

As reported to NorCal MLS Alliance: 3 month rolling sales data. These analyses were performed in good faith with data derived from sources deemed reliable, but they may contain errors and are subject to revision. All numbers approximate.
Days-on-market is an indicator of how quickly buyers are snapping up listings, and it typically rises and falls according to seasonal trends. Houses (blue line) generally sell significantly faster than condos (red line), and the variance between them widened with the pandemic.
Avg. Sales Price to Original List Price Percentage (SP/LP %)
San Francisco Market Dynamics since 2018, 3-Month Rolling Sales

Residential market activity reported to NORCAL MLS® ALLIANCE, per Infosparks. Data from sources deemed reliable, but may contain errors and subject to revision. All numbers are approximate, and may change with late-reported sales.
100% signifies an average sales price at original list price. Overbidding for both houses and condos climbed in 2021, but overbidding for houses runs much higher.
Statistics are generalities, essentially summaries of widely disparate data generated by dozens, hundreds or thousands of unique, individual sales occurring within different time periods. They are best seen not as precise measurements, but as broad, comparative indicators, with reasonable margins of error. Anomalous fluctuations in statistics are not uncommon, especially in smaller, expensive market segments. Last period data should be considered estimates that may change with late-reported data. Different analytics programs sometimes define statistics – such as “active listings,” “days on market,” and “months supply of inventory” – differently: what is most meaningful are not specific calculations but the trends they illustrate. Most listing and sales data derives from the local or regional multi-listing service (MLS) of the area specified in the analysis, but not all listings or sales are reported to MLS and these won’t be reflected in the data. “Homes” signifies real-property, single-household housing units: houses, condos, co-ops, townhouses, duets and TICs (but not mobile homes), as applicable to each market. City/town names refer specifically to the named cities and towns, unless otherwise delineated. Multi-county metro areas will be specified as such. Data from sources deemed reliable, but may contain errors and subject to revision. All numbers to be considered approximate.
Many aspects of value cannot be adequately reflected in median and average statistics: curb appeal, age, condition, amenities, views, lot size, quality of outdoor space, “bonus” rooms, additional parking, quality of location within the neighborhood, and so on. How any of these statistics apply to any particular home is unknown without a specific comparative market analysis.
Median Sales Price is that price at which half the properties sold for more and half for less. It may be affected by seasonality, “unusual” events, or changes in inventory and buying trends, as well as by changes in fair market value. The median sales price for an area will often conceal an enormous variety of sales prices in the underlying individual sales.
Dollar per Square Foot is based upon the home’s interior living space and does not include garages, unfinished attics and basements, rooms built without permit, patios, decks or yards (though all those can add value to a home). These figures are usually derived from appraisals or tax records, but are sometimes unreliable (especially for older homes) or unreported altogether. The calculation can only be made on those home sales that reported square footage.
Compass is a real estate broker licensed by the State of California, DRE 01527235. Equal Housing Opportunity. This report has been prepared solely for information purposes. The information herein is based on or derived from information generally available to the public and/or from sources believed to be reliable. No representation or warranty can be given with respect to the accuracy or completeness of the information. Compass disclaims any and all liability relating to this report, including without limitation any express or implied representations or warranties for statements contained in, and omissions from, the report. Nothing contained herein is intended to be or should be read as any regulatory, legal, tax, accounting or other advice and Compass does not provide such advice. All opinions are subject to change without notice. Compass makes no representation regarding the accuracy of any statements regarding any references to the laws, statutes or regulations of any state are those of the author(s). Past performance is no guarantee of future results.