Bay Area Population Change & Migration

Photo ©Travis Monson (@travismonsonphotography on Instagram, travismonsonphotography.com). Used with permission.
Recently, the U.S. census published annual, county population estimates through 7/1/20; the CA Dept. of Finance released its estimate of state population decline in calendar-year 2020; and the Wall Street Journal ran an article on household migration numbers by county for calendar-year 2020 (based on postal change of address filings).
What we can see here is that the pandemic definitely did have an impact, with an increase in outbound migration from San Francisco and the Bay Area—but it is not a new phenomenon, merely amplified. Since the census data only covers as far as July of last year, when the pandemic was relatively new, I think it will be very interesting to see what the trendlines look like into 2021, and especially through 2022.
Bay Area Population Trends
July 1, 2010 - July 1, 2020

According to U.S. census estimates, the Bay Area population dropped by 52,550 residents or .6% in the year to 7/1/20. In the 10-year period illustrated, the Bay Area population increased by 533,000 residents or 6.8% (including the 2019-2020 decline).
Major factors in population change: domestic migration, foreign migration, and natural causes (births and deaths).
There have been other, recent, widely varying estimates of migration and population changes, using other data sources and methodologies.
U.S. census estimates deemed reliable, but analysis may contain errors and is subject to revision. All numbers are approximate. The census often revises prior year estimates.
1-Year Population Changes
July 1, 2019 — July 1, 2020, by Bay Area County

Some of these changes are so small compared to total population size as to be statistically meaningless (such as in Contra Costa County). Since these estimates go through July 1, 2020, they will not reflect any further effects of the pandemic since that date. It is quite possible that in the second half of 2020, populations rebounded in some Bay Area counties, while others saw further declines.
These analyses were performed in good faith with data derived from sources deemed reliable, but may contain errors and are subject to revision. All numbers should be considered approximate.
The Movement of Bay Area Households in 2020

The above numbers are estimates extrapolated from charts in the 5/11/2021 Wall Street Journal article, "Americans Up & Moved During the Pandemic," based on permanent, postal change-of-address filings in calendar-year 2020. The changes delineated will not correlate perfectly with population changes: The term "household" is a nebulous term that can signify one or many persons. The WSJ analysis does not appear to include foreign immigration (a major factor in many Bay Area counties), and certainly does not include the effect of births and deaths on population. Some Bay Area counties, with both urban and suburban/rural areas, almost certainly saw differing household-movement dynamics between those regions — out-migration was much heavier in urban locales (particularly of tenants). According to the WSJ article, the loss of households in San Francisco doubled in 2020 from 2019. County populations vary: for example, Santa Clara has 14 times as many residents as Napa.
Numbers in this table are very approximate estimates. Compiled in good faith, but may contain errors, and subject to revision.
Bay Area Net DOMESTIC Migration, 2010 — 2020
Resident Movement between the Bay Area & Other U.S. Locations

Instead of precise domestic migration numbers, this analysis is best considered an indicator of significant trends in population movements into and out of the Bay Area. Such changes vary widely by county.
Chart does not include net foreign migration (see below), a major factor in Bay Area population changes.
Changes measured from July 1st of previous year to July 1st of labeled year.
U.S. Census estimates for 11 Bay Area Counties, as published on May 4, 2021. Data from sources deemed reliable but may contain errors and subject to revision. All numbers are approximate.
Bay Area Net FOREIGN Migration, 2010 — 2020
Resident Movement between 11 Bay Area Counties & Other Countries

NET FOREIGN MIGRATION: The difference between the number of people moving into the Bay Area from other countries and the number of local residents moving abroad. Immigration has played a large role in Bay Area population changes, though it has dwindled in recent years.
U.S. Census estimates 11 Bay Area Counties, as published on May 4, 2021. As of July 1st of each year. Data from sources deemed reliable but may contain errors and subject to revision. All numbers are approximate.
"Natural Cause" Effects on Bay Area Population Births & Deaths, 2011 - 2020
Changes measured from July 1st of previous year to July 1st of labeled year.
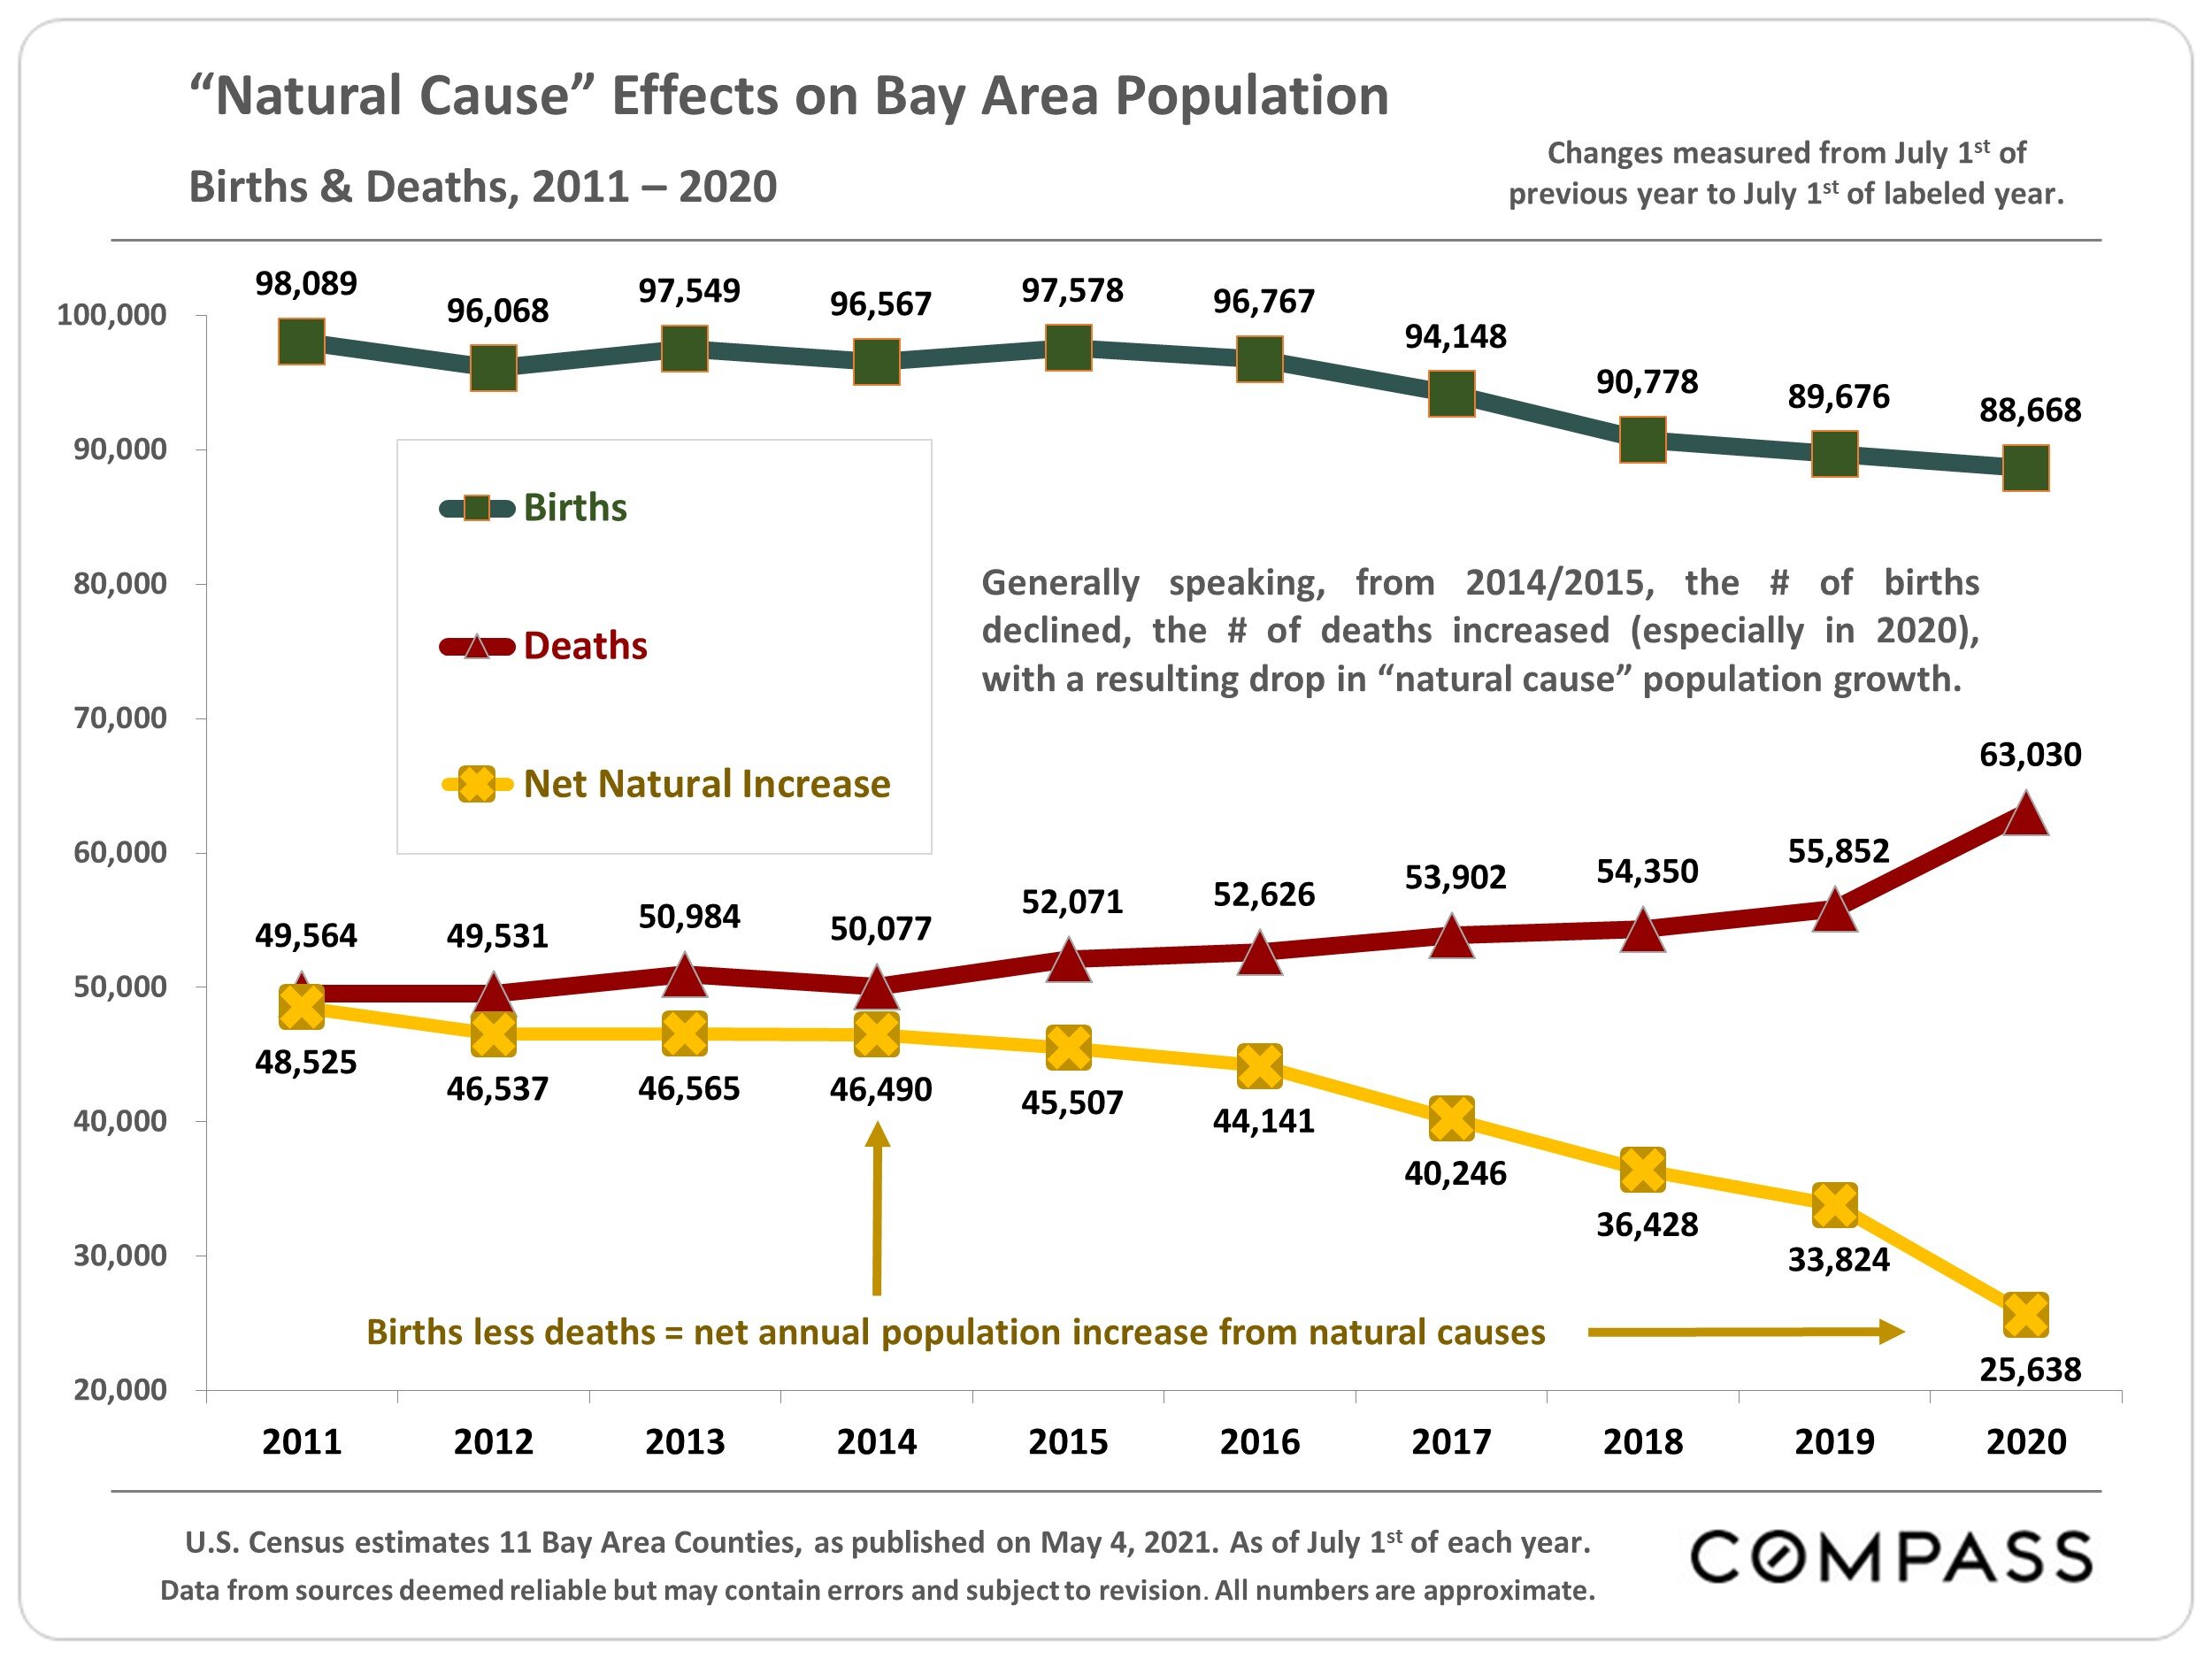
Generally speaking, from 2014/2015, the # of births declined, the # of deaths increased (especially in 2020), with a resulting drop in "natural cause" population growth.
U.S. Census estimates 11 Bay Area Counties, as published on May 4, 2021. As of July 1st of each year. Data from sources deemed reliable but may contain errors and subject to revision. All numbers are approximate.
San Francisco Bay Area Employment Trends
Number of Employed Residents, 2000 — 2020
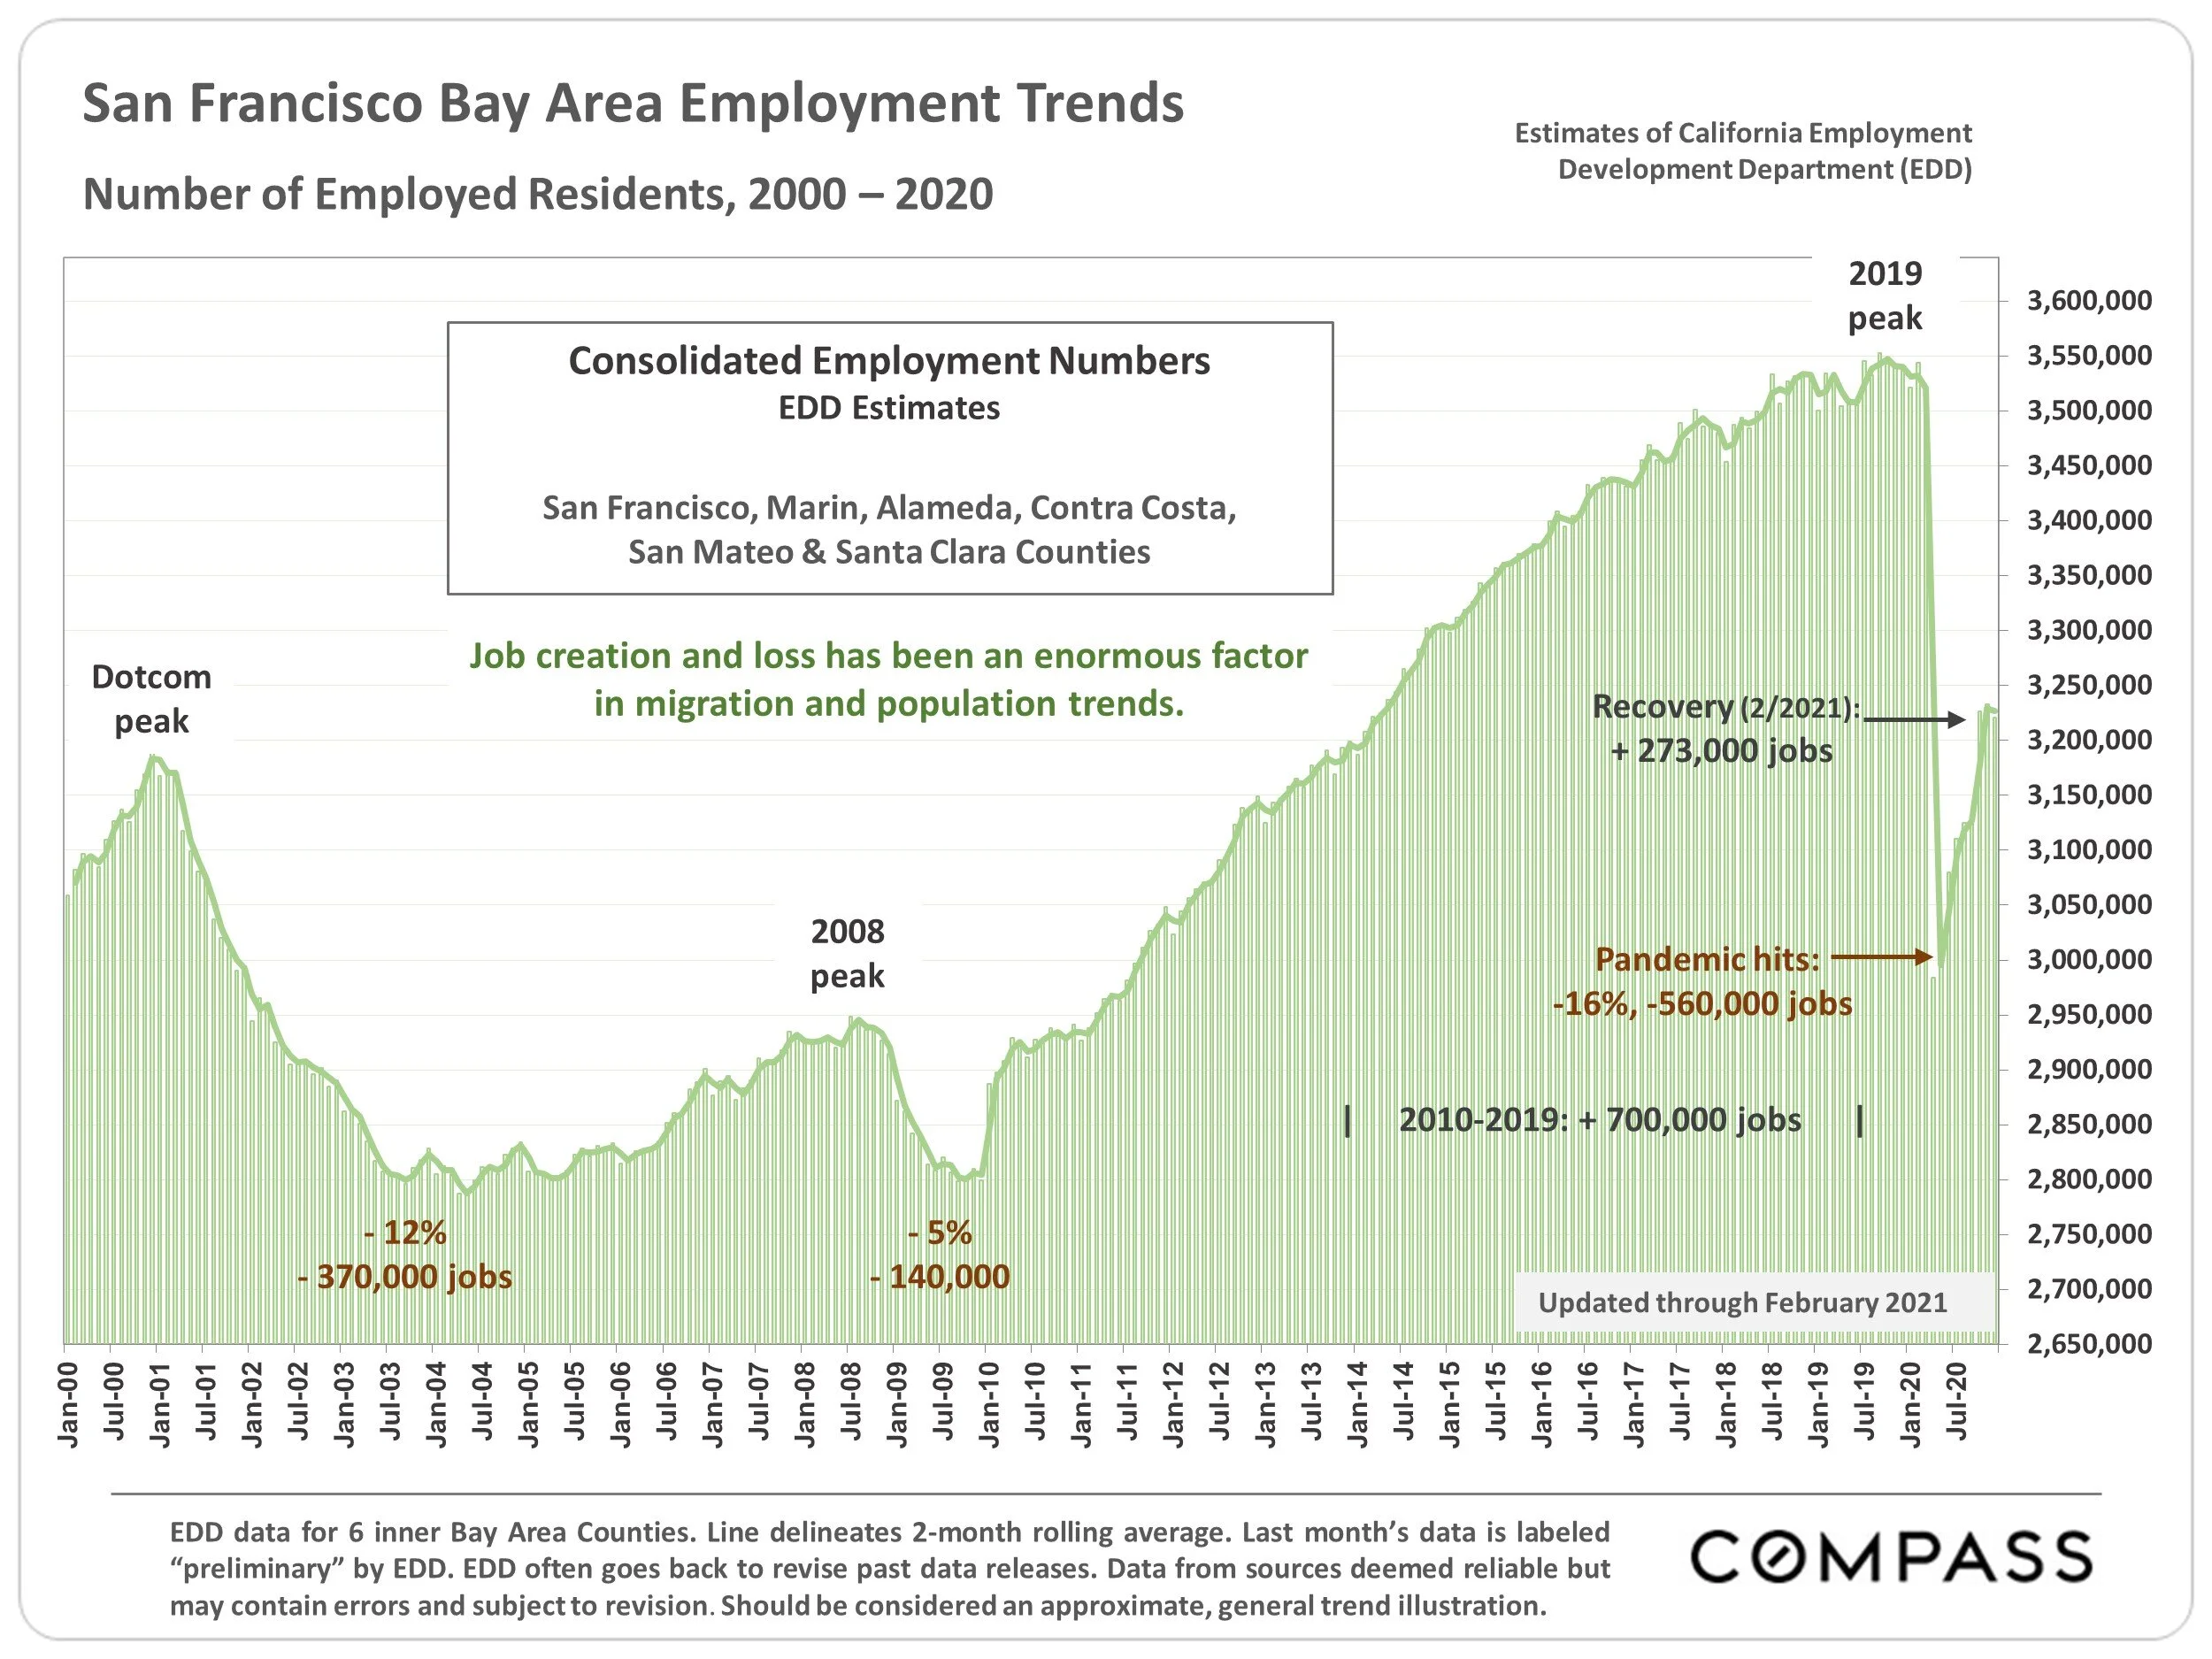
Job creation and loss has been an enormous factor in migration and population trends.
EDD data for 6 inner Bay Area Counties. Line delineates 2-month rolling average. Last month's data is labeled "preliminary" by EDD. EDD often goes back to revise past data releases. Data from sources deemed reliable but may contain errors and subject to revision. Should be considered an approximate, general trend illustration.
Bay Area Population Trends
July 1, 2010 — July 1, 2020, by County
U.S. census numbers, on which most of these charts are based, are estimates, with reasonable margins of error, and not uncommonly revised in later estimates. The latest state and county population and migration numbers, released on 5/4/21, only runs through 7/1/20. They will not reflect population changes occurring in the second half of 2020 when migration numbers almost certainly increased.
Per a CA Dept. of Finance report released 5/7/21 , California's population dropped in calendar-year 2020 by 182,000, the first decline since its founding in 1850. This would suggest a significant acceleration in state out-migration from the U.S. census's CA decline estimate of 69,500 for the 12 months through 7/1/20. Earlier in this report is data from a Wall Street Journal article on household migration numbers in calendar-year 2020, based on postal change-of-address filings. Other migration estimates, often using different data sources and methodologies — U-Haul rentals, online home searches, surveys/polls, policy institute analyses, and so on —have been published in the last year, often with widely varying conclusions.
Factors behind migration and population change include new and relocated employment, work from home, and loss of employment; housing costs and general cost of living; state and local taxes; retirement; family issues; ecological disasters; local, national and international politics; natural causes (births, deaths); and other quality of life issues (commute, crime, population density, etc.) — and often a combination of these.
Generally speaking, when residents of Bay Area counties move out of county, the largest number move to another Bay Area county; the next largest proportion move to CA counties outside, but often adjacent to, the Bay Area; and a smaller proportion move out of state — WA, TX, OR, NV, AZ, CO are all major locations, for employment, taxation, cost of living, quality of life, and/or other reasons. Of residents moving out of urban areas in the past year, the largest number were almost certainly tenants, who tend to skew younger than homeowners, were hit harder by job losses, and who can move quickly to reduce housing costs.
It is unknown how migration trends may change with the many factors currently in play.
Data from sources deemed reliable, but analysis may contain errors and subject to revision. All numbers are approximate.

According to U.S. census estimates, all 11 Bay Area Counties saw population declines, from .05% and .1% (Contra Costa, Solano) to 1.2% and 1.4% (Napa, San Francisco) in the year to 7/1/20. The overall, 1-year decline was 52,550 residents or .6%.
Estimates as of July 1 of each year, per U.S. Census, published 5/4/21. Data from sources deemed reliable but may contain errors and subject to revision. The census often revises prior year estimates. All numbers approximate.
Bay Area County Populations
Per U.S. Census Estimates, July 1, 2020

Estimates as of July 1 2020, per U.S. Census, published 5/4/21. Data from sources deemed reliable but may contain errors and subject to revision. The census often revises prior year estimates.
San Francisco Population Trends since 2010
Per U.S. Census Data, July 1st to July 1st Estimates

There have been other, widely varying estimates of much greater population loss since the pandemic struck using other data sources and methodologies (whose reliability we cannot judge).
Estimates as of July 1 of each year, per U.S. Census, published 5/4/21. Data from sources deemed reliable but may contain errors and subject to revision. The census often revises prior year estimates. All numbers approximate.