April 2022 Market Report

Jellies at the Aquarium of the Pacific by Cory Doctorow on Flickr via Creative Commons license.
Sales were robust in Q1 for all property types, but the supply of house listings in particular was very low. However, as of March 31st, mortgage interest rates have skyrocketed 50% in 2022, with a particularly large jump in March. Because of the time involved in the home-buying process – the search, loan qualification, going into contract, escrow, closing sale – any significant effects of the recent spike won’t show up until Q2. Rates may stabilize, rise further, or drop back down – they can change very quickly – and the exact, follow-on effects are unknown. Interest rates are only 1 factor: Local economic conditions, financial markets, wealth creation, housing affordability, consumer confidence, inflation, migration, the pandemic, rents, debt and government policies can all have big market impacts, and they are flashing both positive and negative signals.
For buyers financing their purchase, interest rates play an enormous role in monthly housing costs. Depending on the speed and scale of changes, declining interest rates can help supercharge demand, as they did in 2021, while rapidly increasing rates typically cool the market, as occurred in the 2nd half of 2018. If both interest rates and home prices soar, there is a double whammy on housing affordability. It is very difficult to accurately predict interest rate changes: 3 months ago, Freddie Mac predicted an average, 30-year, fixed rate of 3.6% for 2022; at the end of March, it hit 4.67%.
When we speak of “low inventory,” it does not necessarily mean fewer homes put up for sale. Sales volumes hit multi-year highs in 2021, fed by an increase in new listings. But “inventory” is measured by what is for sale on a given day, and even if the quantity of new listings is steady or climbing, the number of active listings can drop if they are selling more quickly. Within the city, supply and market dynamics vary significantly between houses and condos (including co-ops/TICs in this category).
This report contains analyses reviewing many of these issues through Q1 2022. Q2 is typically the highest-demand, most active selling season of the year.
San Francisco House Price Trends
Median House Sales Prices, 2012 – Present, by Quarter

Median sales price is that price at which half the sales occurred for more and half for less. It is a very general statistic that can be affected by other factors besides changes in fair market value. All numbers are approximate and subject to revision. Last quarter may change with late reported sales.
Q1 2021 to Q1 2022, the median house sales price increased by 14%. Median sales price is that price where half the homes sold for more and half for less. It is a very general statistic that disguises a wide range of prices in the underlying sales. Seasonal fluctuations are common, and it’s not unusual for median sales prices to peak for the year in spring (Q2). Longer-term trends are more meaningful than short-term changes.
San Francisco Condo Price Appreciation
Median Condo Sales Prices, 2012 – Present, by Quarter

Median sales price is that price at which half the sales occurred for more and half for less. It is a very general statistic that can be affected by other factors besides changes in fair market value. All numbers are approximate and subject to revision. Last quarter may change with late reported activity. Does not include new-project condo sales unreported to MLS.
The much greater supply of condos on the market has reduced upward pressure on median sales prices, though they did climb 4% from Q1 2021 to Q1 2022.
San Francisco House Sales Statistics
A Sampling of San Francisco’s 70+ Neighborhoods. 6 Months’ Sales*

*Sales reported to NORCAL MLS® ALLIANCE, 9/15/21-3/15/22. Sales price to LP % for sales which accepted offers within 30 days. Data from sources deemed reliable but may contain errors and subject to revision. All numbers approximate and can change on a daily basis. Not all listings provide square footage. Days on market adjusted for outliers.
San Francisco Condo Sales Statistics
6 Months Sales: 2-Bedroom, 2-Bath Condos*

*Sales of 2BR/2BA units reported to NORCAL MLS® ALLIANCE, 9/15/21 – 3/15/22. Sales price to LP % for sales accepting offers within 30 days. Data from sources deemed reliable but may contain errors and subject to revision. Numbers are approximate and can change on a daily basis. Days on market adjusted for outliers.
Within compilations of sales, gradations in quality of location, construction, condition, amenities, home & lot size are almost infinite. This is a snapshot of house and condo sales in just a few of SF’s more than 70 neighborhoods.
Active Listings on Market
San Francisco Real Estate Market Dynamics & Seasonality

Per Realtor.com Research: https://www.realtor.com/research/data/, listings posted on site. Data from sources deemed reliable, but may contain errors and subject to revision. May not include “coming soon” listings. All numbers should be considered approximate.
A snapshot measure of how many active listings can be expected on any given day of the specified month. It is affected by 1) the # of new listings coming on market, 2) how quickly buyers put them into contract, 3) the sustained heat of the market over time. It typically fluctuates seasonally.
San Francisco is the only Bay Area County in which the number of active listings is higher than before the pandemic, but that is due to the increase in condo listings: The inventory of active house listings has been running lower.
San Francisco Homes Market: Supply & Demand*
Active & Coming-Soon Listings vs. 12 Months Sales

* Active/Coming-Soon listings posted to NorCal MLS Alliance vs. 12 months sales of MLS home listings through 2/28/22. Data from sources deemed reliable, but may contain errors and subject to revision. Not all listings are posted to MLS. All numbers approximate. The number of active listings constantly changes.
As of April 1, 2022, the number of active/coming-soon listings posted to MLS equaled 2 months supply of inventory as compared to 12 months sales. Generally speaking, under 3 months of inventory is typically considered a “seller’s market.”
Of the active listings on April 1st, 265 were houses, and 856 were condos, co-ops and TICs. Does not include new-project condos not listed on MLS.
The quantity of active listings on a given day is affected by 1) the number of new listings coming on market, 2) how quickly buyers put them into contract, and 3) the sustained heat of the market over time. The number typically ebbs and flows by season, climbing as the spring market accelerates.
Mortgage Interest Rate Trends, 2016 – Present
30-Year Conforming Fixed-Rate Loans, Weekly Average Readings

Interest rates may fluctuate suddenly and dramatically, and it is very difficult to predict rate changes. Data from sources deemed reliable but not guaranteed. Anyone interested in residential home loans should consult with a qualified mortgage professional and their accountant.
Per Freddie Mac (FHLMC), on March 31, 2022, the weekly, average, 30-year interest rate was 4.67%, up 50% from 3.11% on 12/30/21. The low of 2.65% occurred in January 2021. In November 2018, the rate was 4.94%.
“Mortgage rates continued moving upward in the face of rapidly rising inflation… [Home] purchase demand has weakened modestly [nationally] but has continued to outpace expectations. This is largely due to unmet demand from first-time homebuyers…”
- Freddie Mac (FHLMC), March 31, 2022
San Francisco Housing Affordability
Q1 2021 to Q1 2022: Increases in Price, Downpayment, Monthly Payment*

*Median sales prices for houses of 3 bedrooms, 1400 to 1750 square feet, as reported to NorCal MLS Alliance. Approx. interest rates per FHLMC, at end of Q1 of each year. Approx. monthly payments per Bankrate.com include estimated property taxes and minimal insurance costs. Data from sources deemed reliable, but may contain errors and subject to revision. All numbers approximate. Interest rates often change quickly, dramatically. Consult your accountant and loan agent.
An approximate, sample illustration: Calculations pertain to median HOUSE sales prices, with 20% down payment, adjusting estimated monthly home payment for the 46% increase in the fixed 30-year, conforming loan rate over the 1 year. Change in interest rate caused the % increase in monthly payment to outpace jump in house price.* (This chart reflects 3-BR house prices. YoY, Q1 2022 median condo sales prices increased 4%.)
In other words, even though median house sales price has gained by 15%, due to the rise in interest rates, monthly mortgage payments in this model gained by 34%.
San Francisco Market Dynamics & Seasonality
New Listings Coming on Market

Per Realtor.com Research: https://www.realtor.com/research/data/, listings posted on site. Data from sources deemed reliable, but may contain errors and subject to revision. All numbers should be considered approximate.
The number of new listings coming on market has been rapidly increasing as we move into the heart of the spring selling season, as is typical.
Listings Pending Sale (in Contract)

Per Realtor.com Research: https://www.realtor.com/research/data/, listings posted on site. Data from sources deemed reliable, but may contain errors and subject to revision. All numbers should be considered approximate.
This is a snapshot measure of how many house and condo listings pending sale (in contract) can be expected on any given day of the specified month. Market activity typically peaks in mid-late spring, slows in summer, and then spikes up again in fall.
Unit Home Sales by Month since 2019

Activity reported to NorCal MLS Alliance, per Infosparks. Data from sources deemed reliable but may contain errors and subject to revision. All numbers are approximate. Last month numbers estimated based on available data.
Sales volume usually ebbs and flows by season: Up in spring, down in summer, back up in fall, and way down in mid-winter. Sales closing in one month mostly reflect accepted offers in the previous month. Does not include new-project condo sales unreported to MLS.
San Francisco Higher-Price Home Sales since 2018
Houses - $3 Million+, Condos - $2 Million+, by Quarter
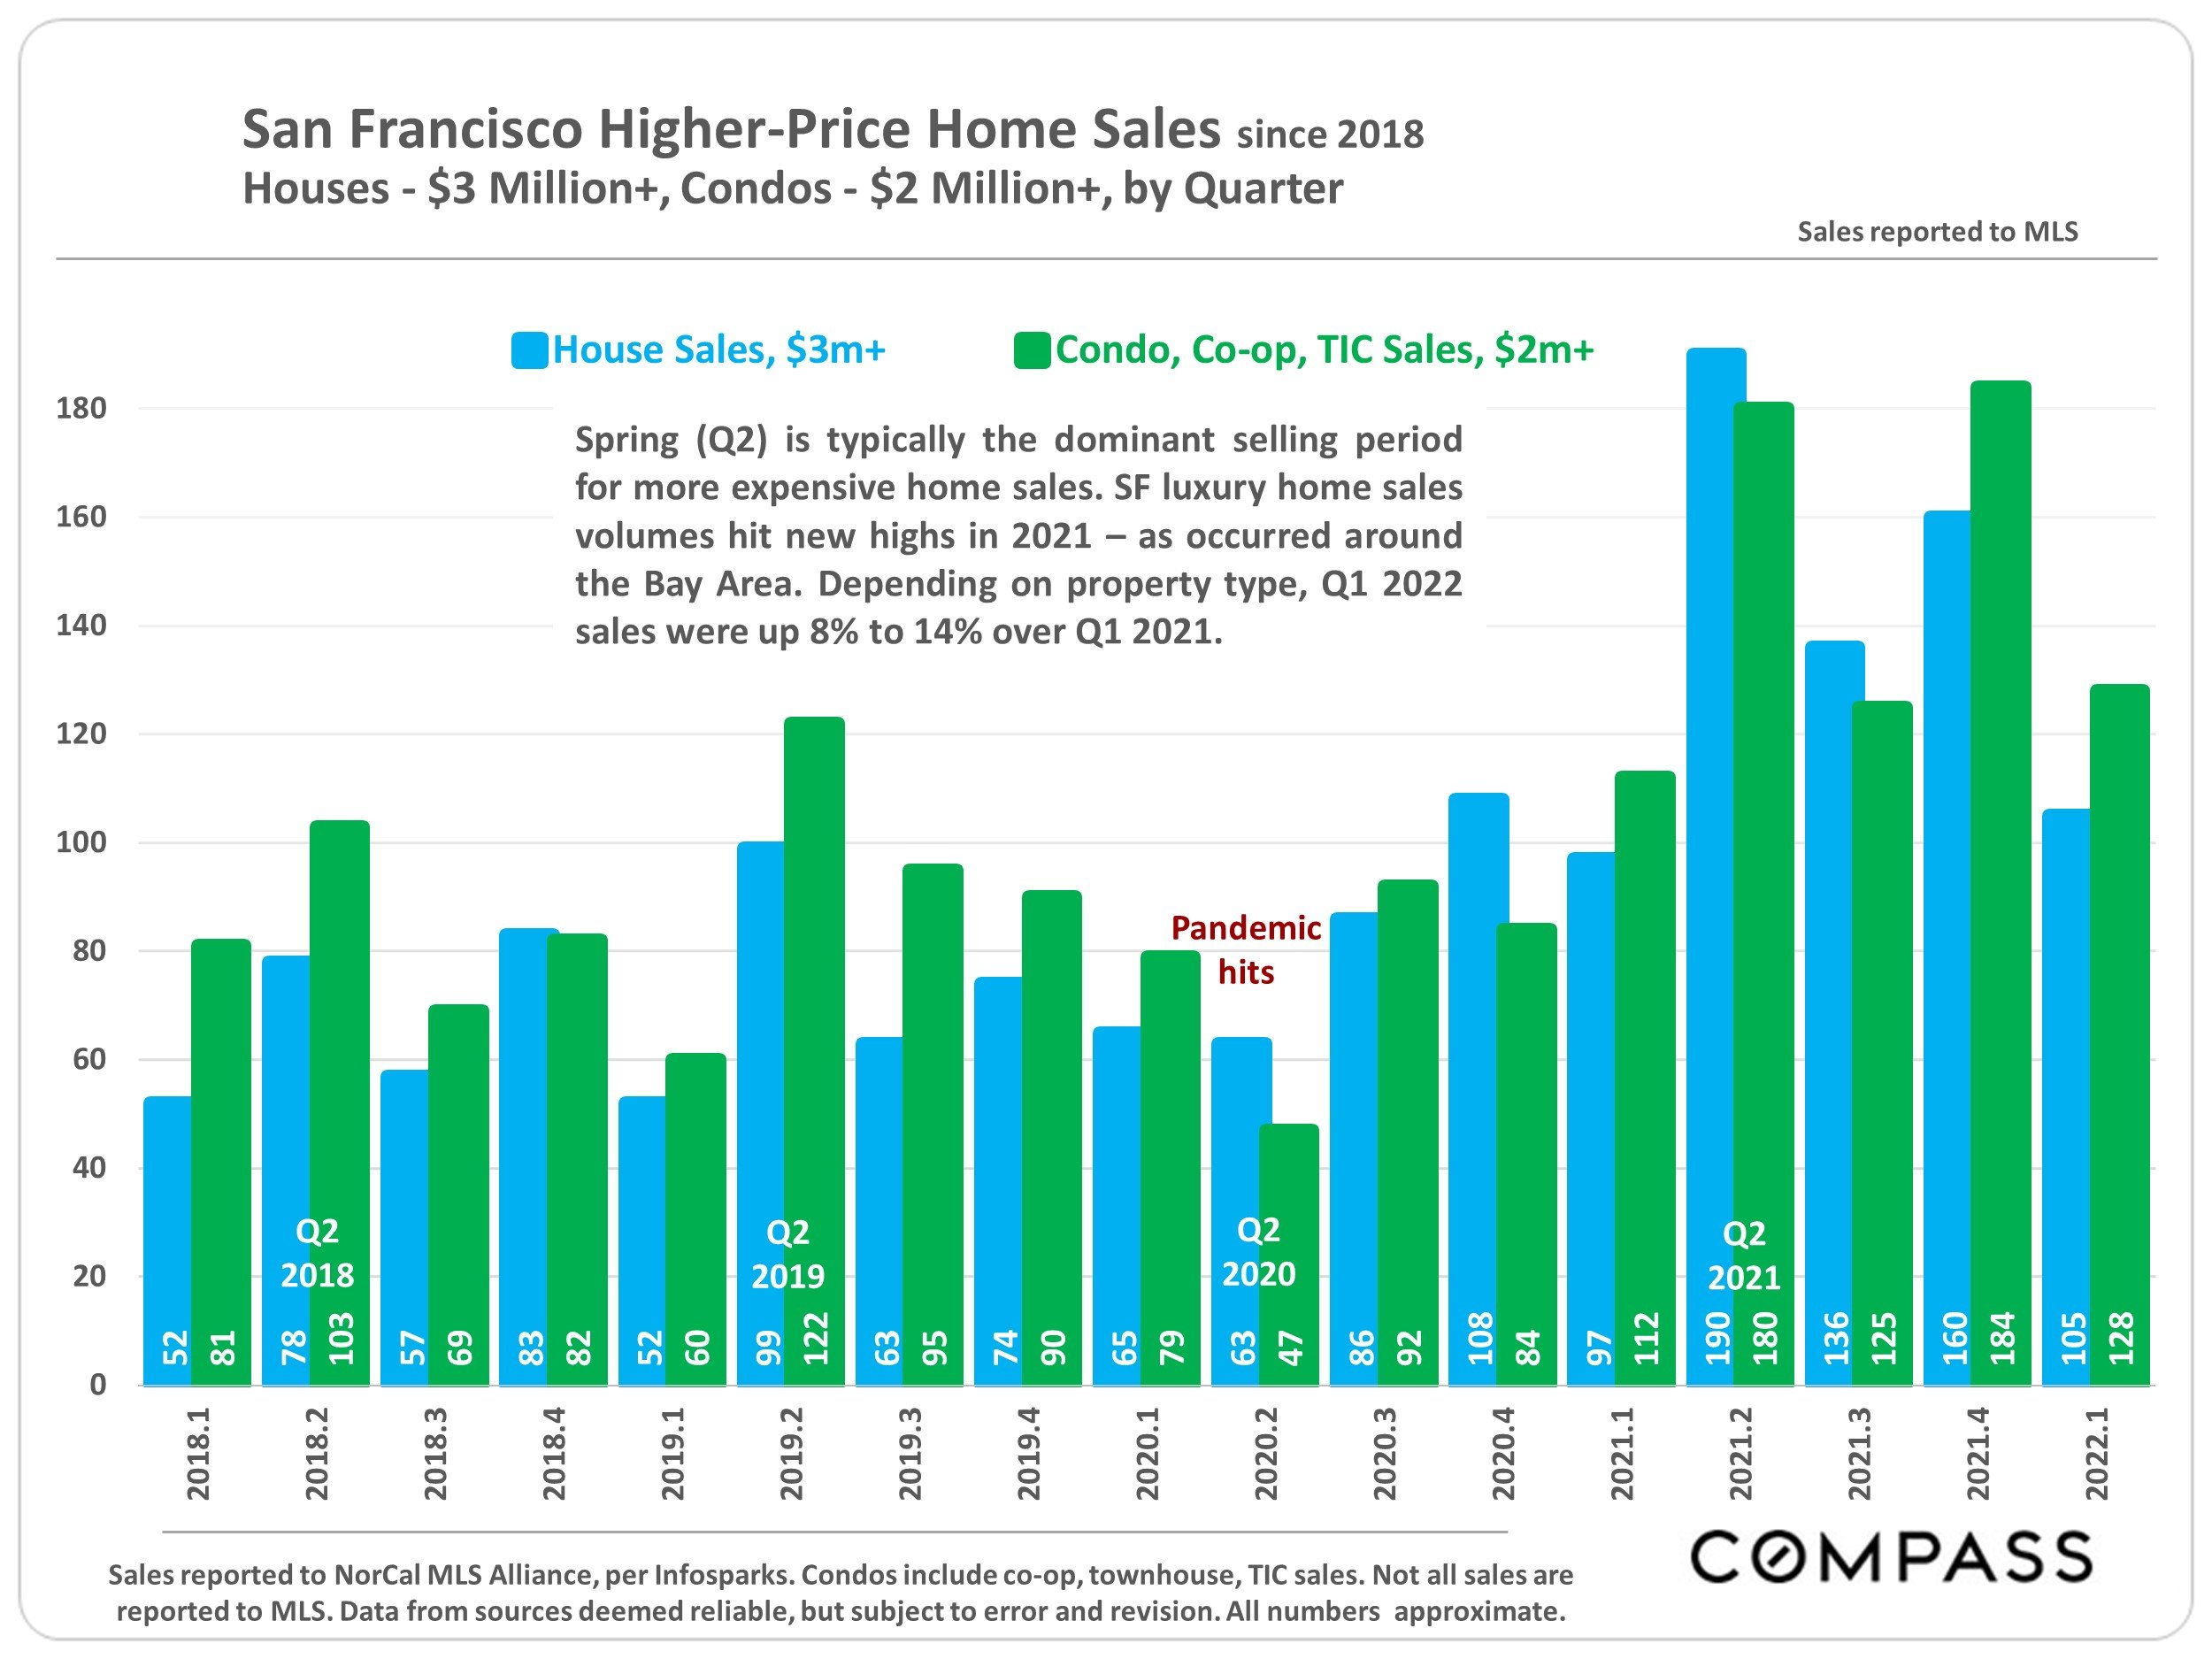
Sales reported to NorCal MLS Alliance, per Infosparks. Condos include co-op, townhouse, TIC sales. Not all sales are reported to MLS. Data from sources deemed reliable, but subject to error and revision. All numbers approximate.
Spring (Q2) is typically the dominant selling period for more expensive home sales. SF luxury home sales volumes hit new highs in 2021 – as occurred around the Bay Area. Depending on property type, Q1 2022 sales were up 8% to 14% over Q1 2021.
Price Reductions on Active Listings

Per Realtor.com Research: https://www.realtor.com/research/data/. Data from sources deemed reliable, but may contain errors and subject to revision. All numbers should be considered approximate.
The number of price reductions usually climbs at the end of the spring selling season before the market (typically) slows down for summer, and surges at the end of the autumn before the (usual) big mid-winter slowdown. Price reductions climbed to a somewhat higher level than is typical for early spring in March 2022.
Overbidding List Prices in San Francisco
Percentage of Home Sales Closing over List Price, since 2020
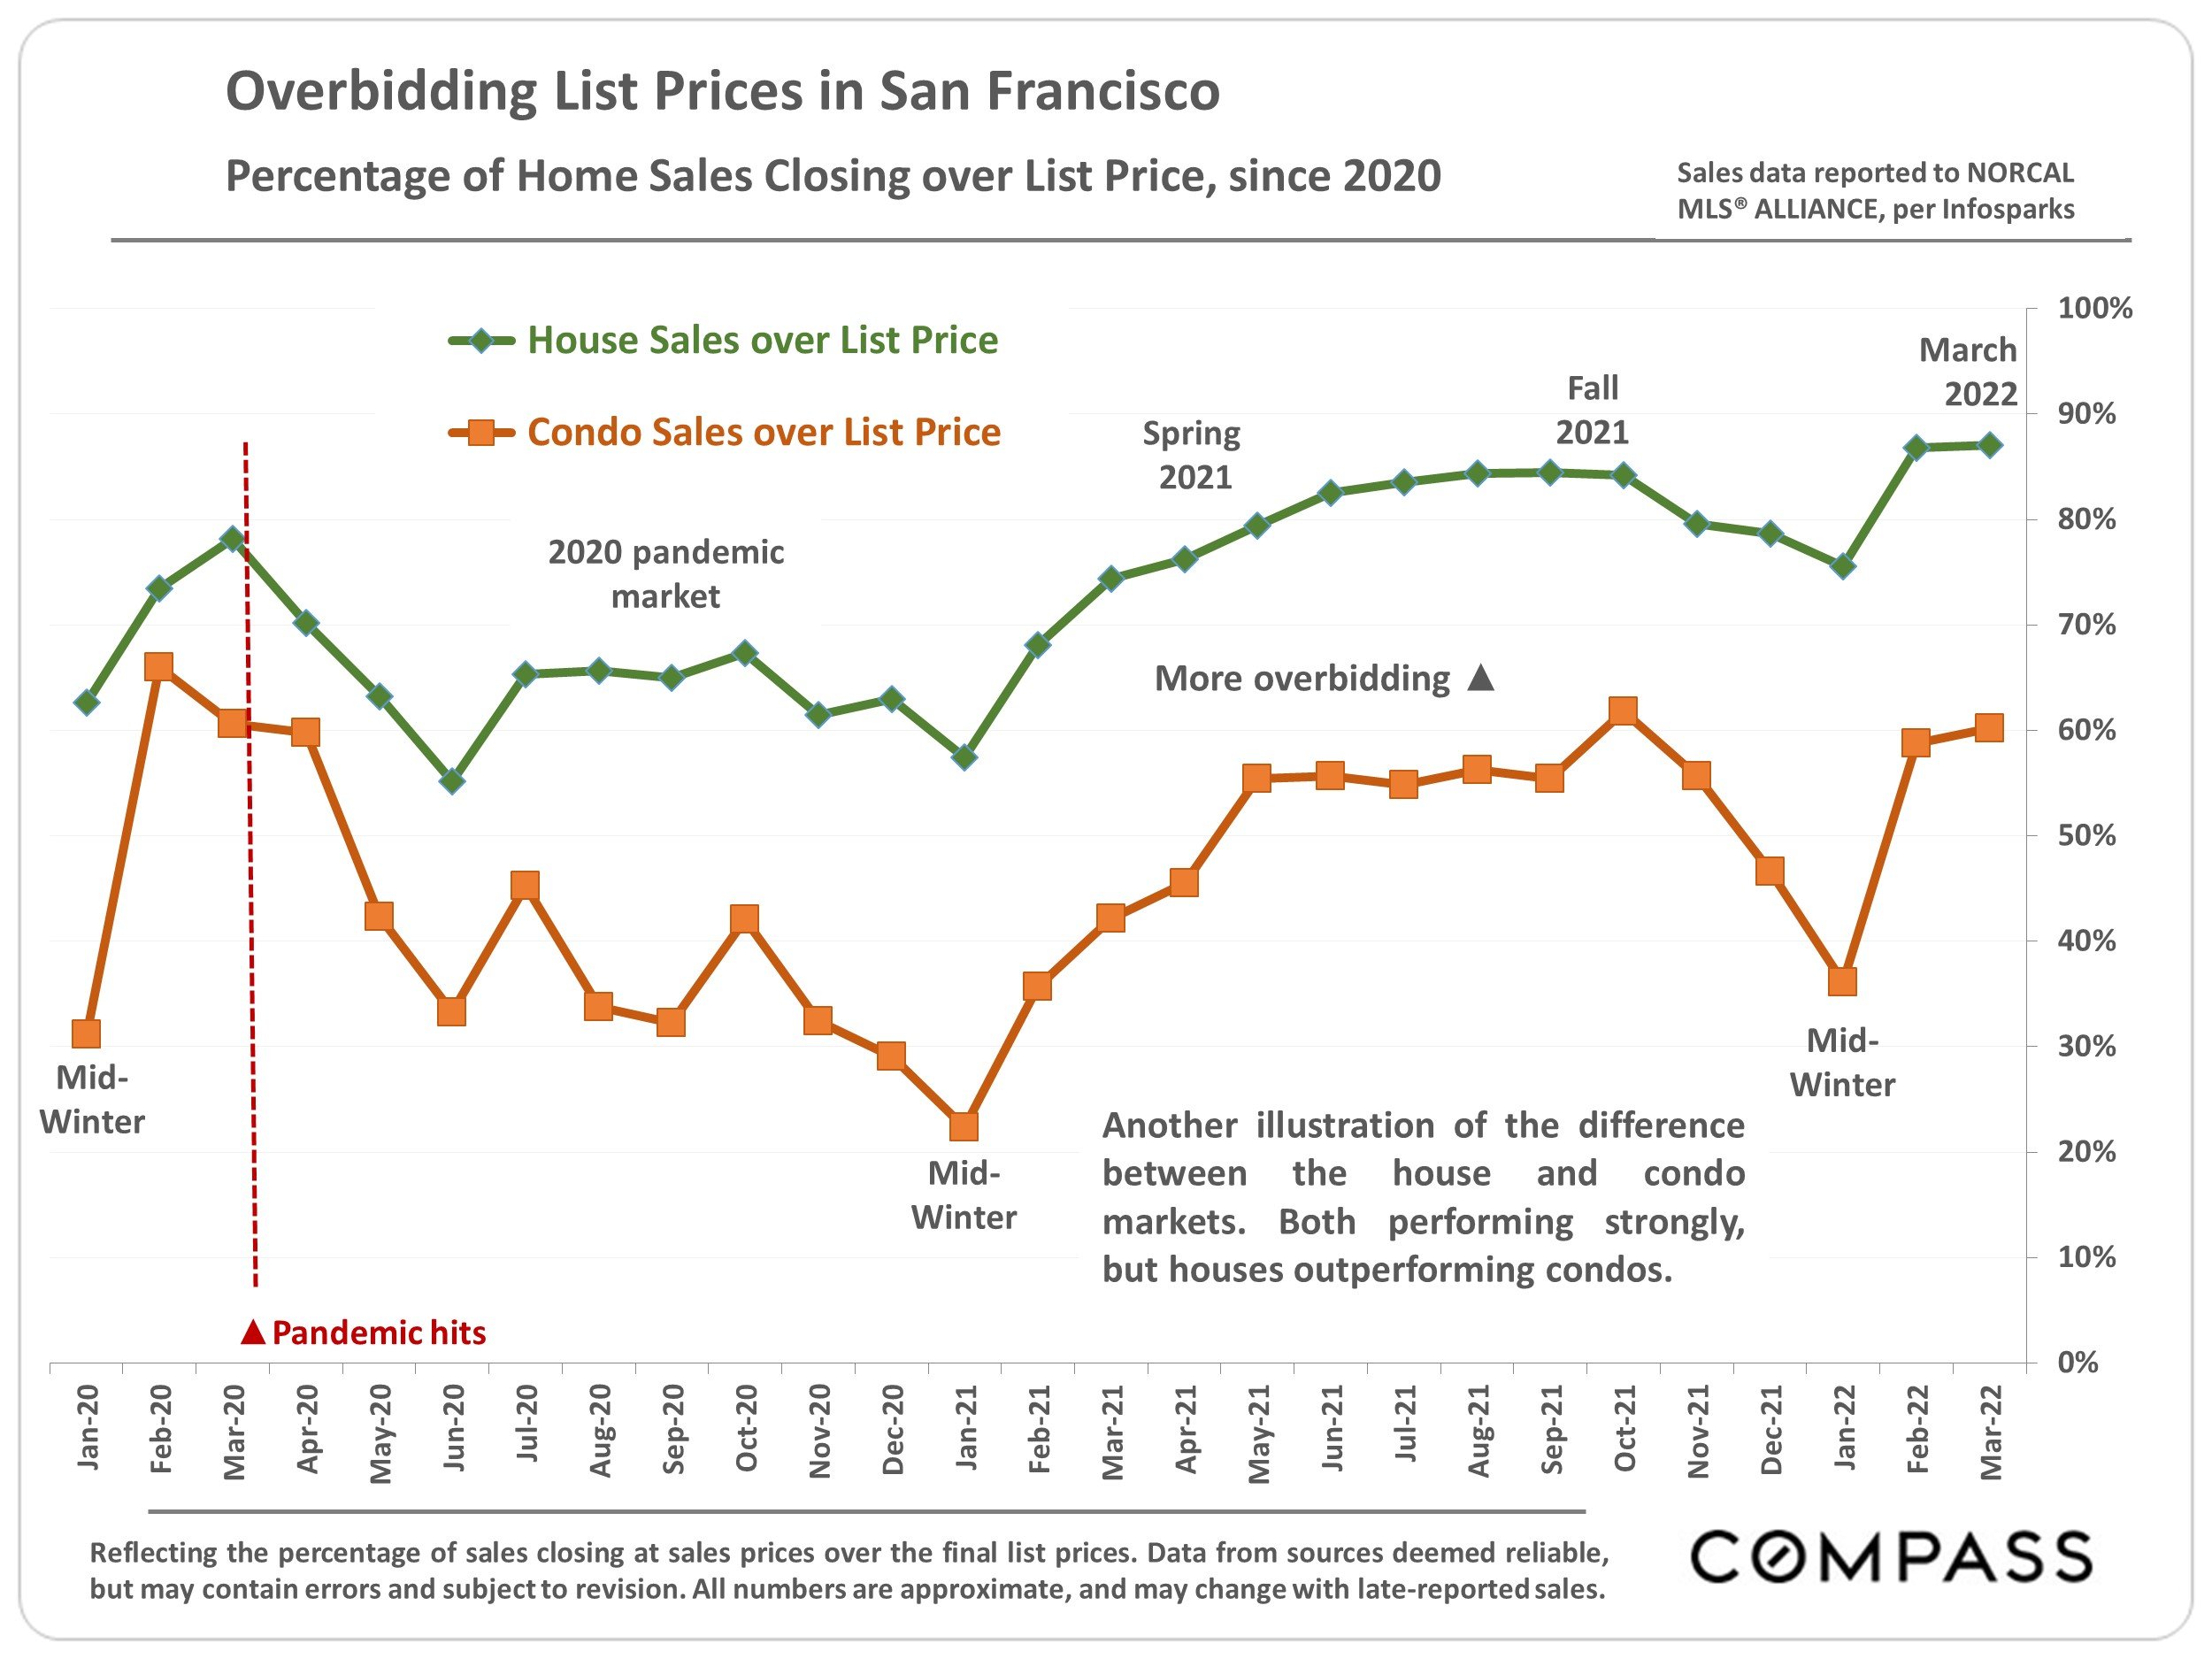
Reflecting the percentage of sales closing at sales prices over the final list prices. Data from sources deemed reliable, but may contain errors and subject to revision. All numbers are approximate, and may change with late-reported sales.
Another illustration of the difference between the house and condo markets. Both performing strongly, but houses continue to outperform condos.
Avg. Sales Price to Original List Price Percentage (SP/LP %)
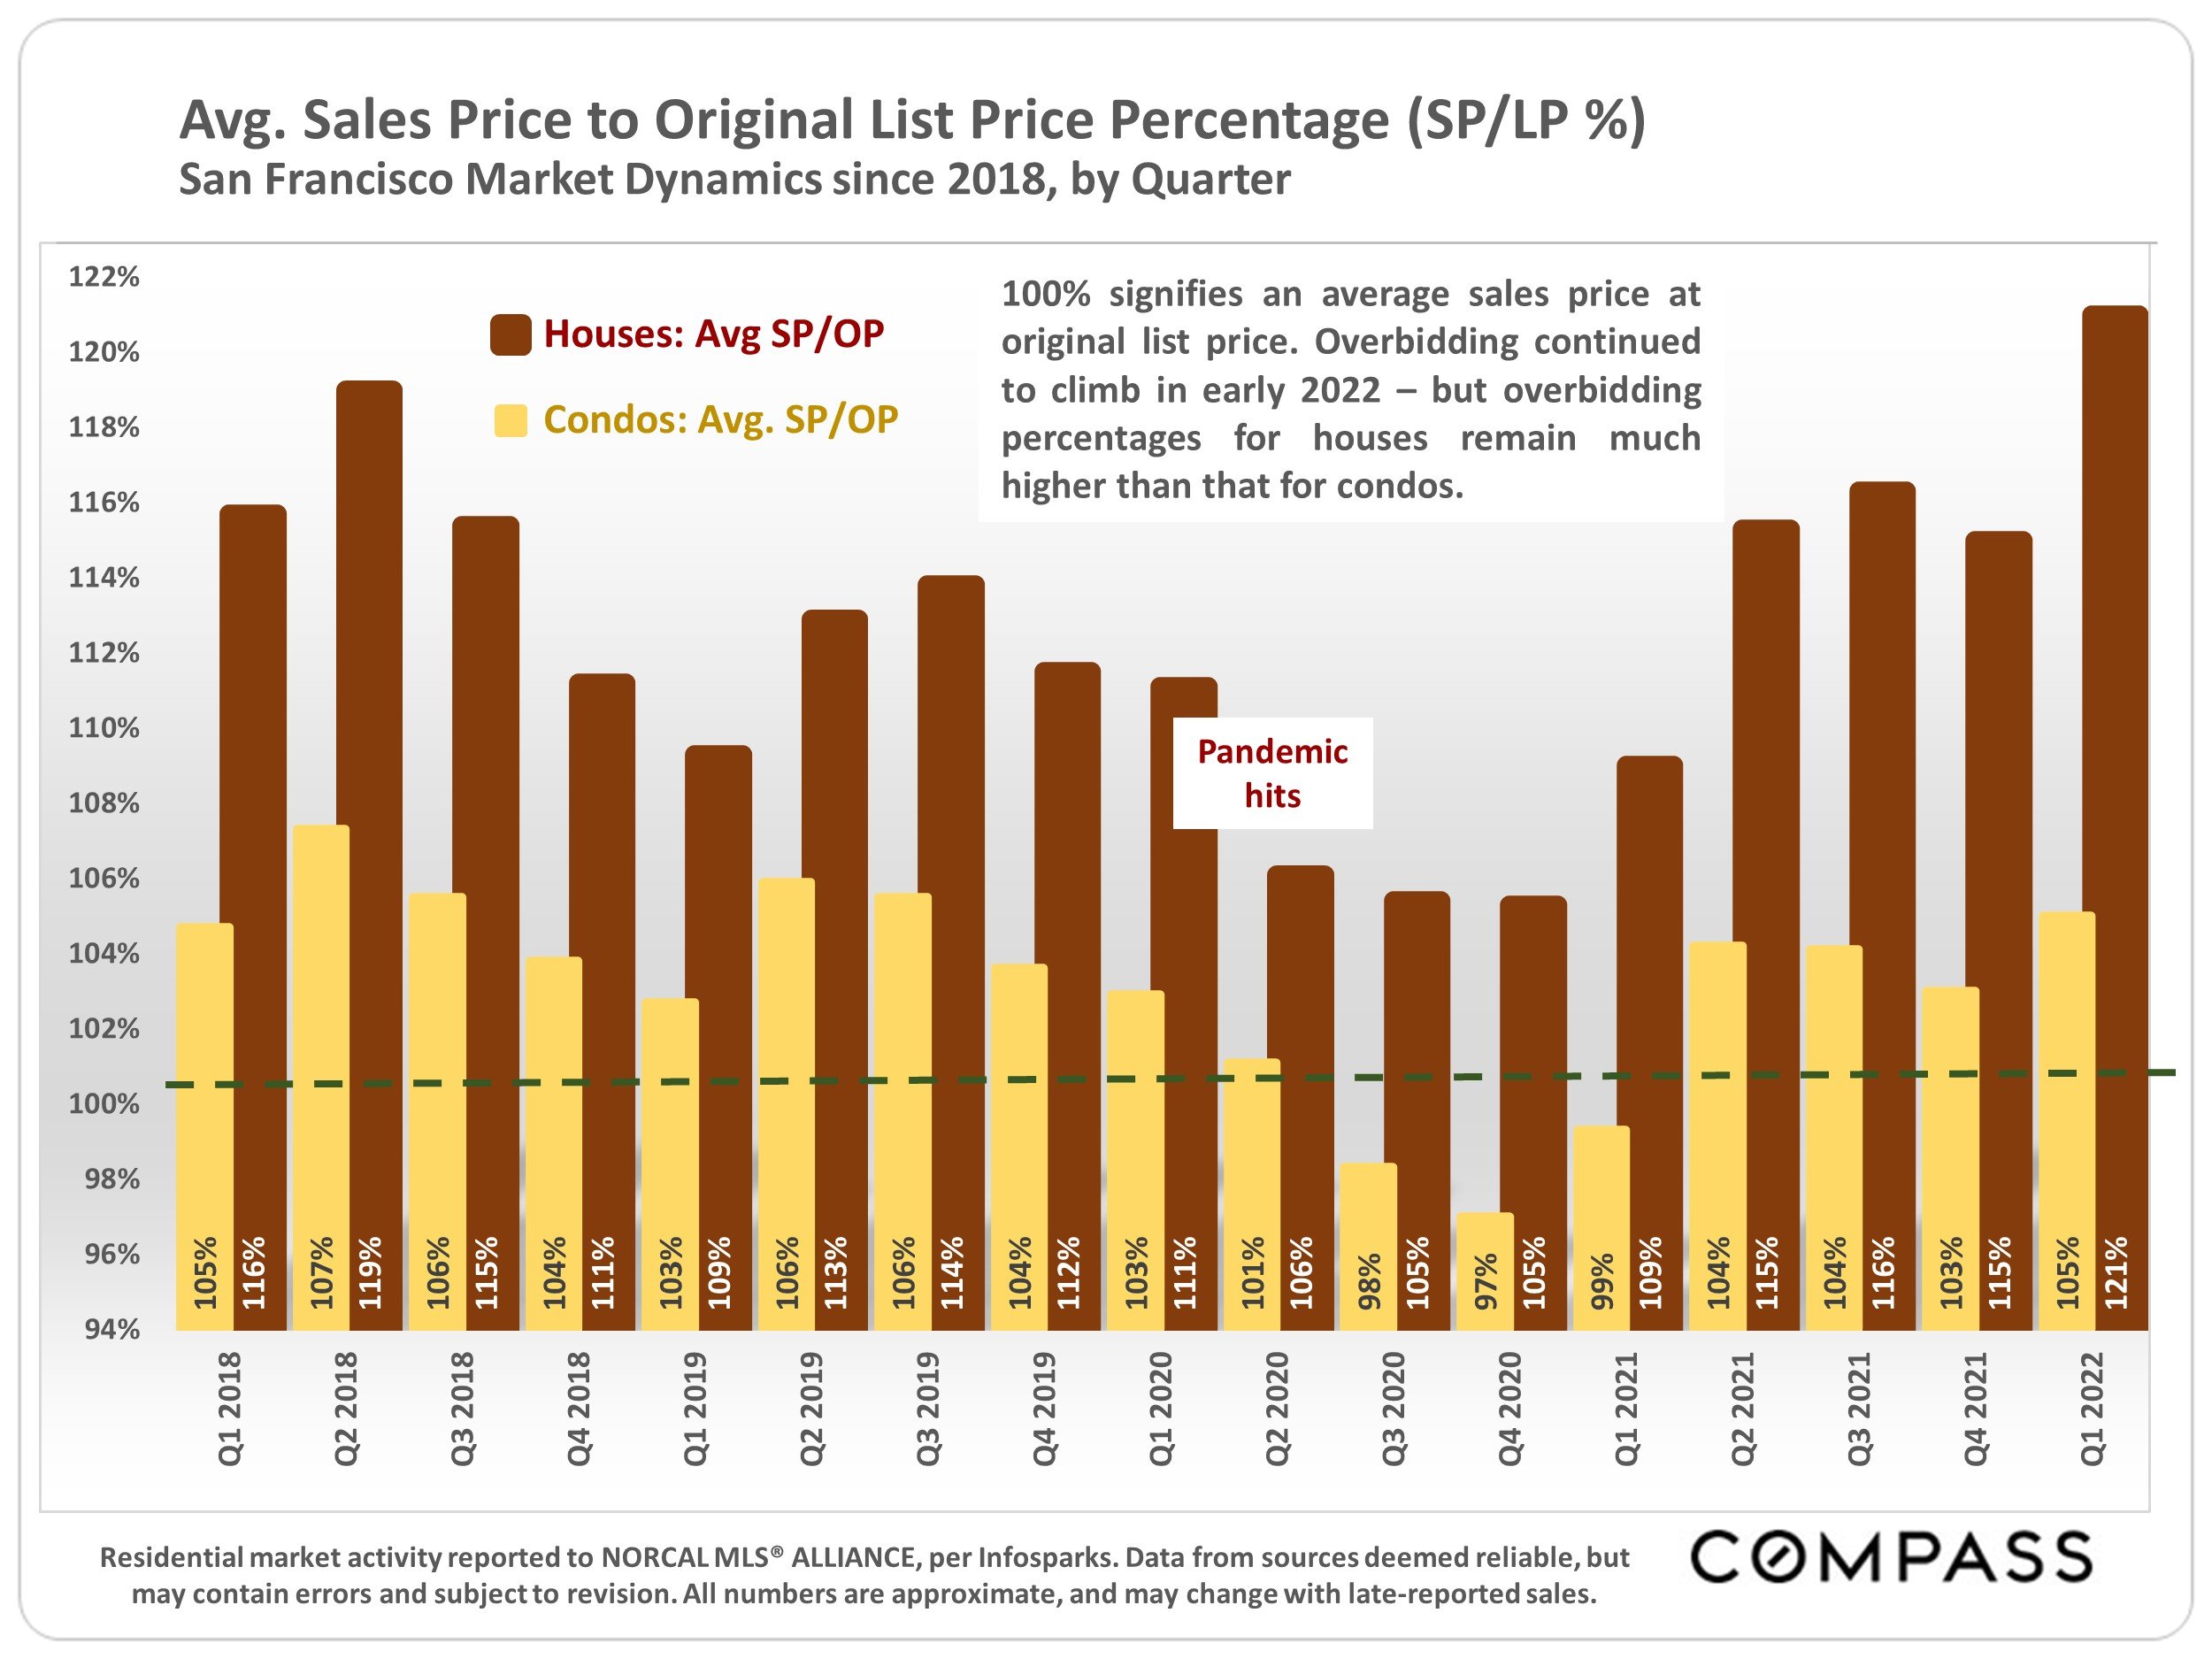
Residential market activity reported to NORCAL MLS® ALLIANCE, per Infosparks. Data from sources deemed reliable, but may contain errors and subject to revision. All numbers are approximate, and may change with late-reported sales.
100% signifies an average sales price at original list price. Overbidding continued to climb in early 2022 – but overbidding percentages for houses remain much higher than that for condos. overbidding has rebounded from pandemic lows. particularly for condos.
Average Days on Market by Quarter

Activity reported to NORCAL MLS® ALLIANCE, per Infosparks. “Condos” include co-op and TIC sales. Data from sources deemed reliable, but may contain errors and subject to revision. All numbers approximate, and may change with late-reported sales.
Generally speaking, the lower the average days on market, the stronger the buyer demand. House listings in SF sell more quickly than condos, co-ops and TICs. Buyer demand for condos has returned to pre-pandemic levels, while demand for houses has increased.
Market Conditions
San Francisco Bay Area Unemployment Rates
Selected Bay Area Counties, 2019 – 2022 YTD

Data from sources deemed reliable, but may contain errors and subject to revision. All percentages to be considered approximate estimates.
Unemployment has steadily declined – to what would typically be considered very low percentages –since the initial pandemic effect, though not yet quite back to the record lows prevalent in 2019.
Consumer Price Index
12-Month Percentage Change, Past 20 Years
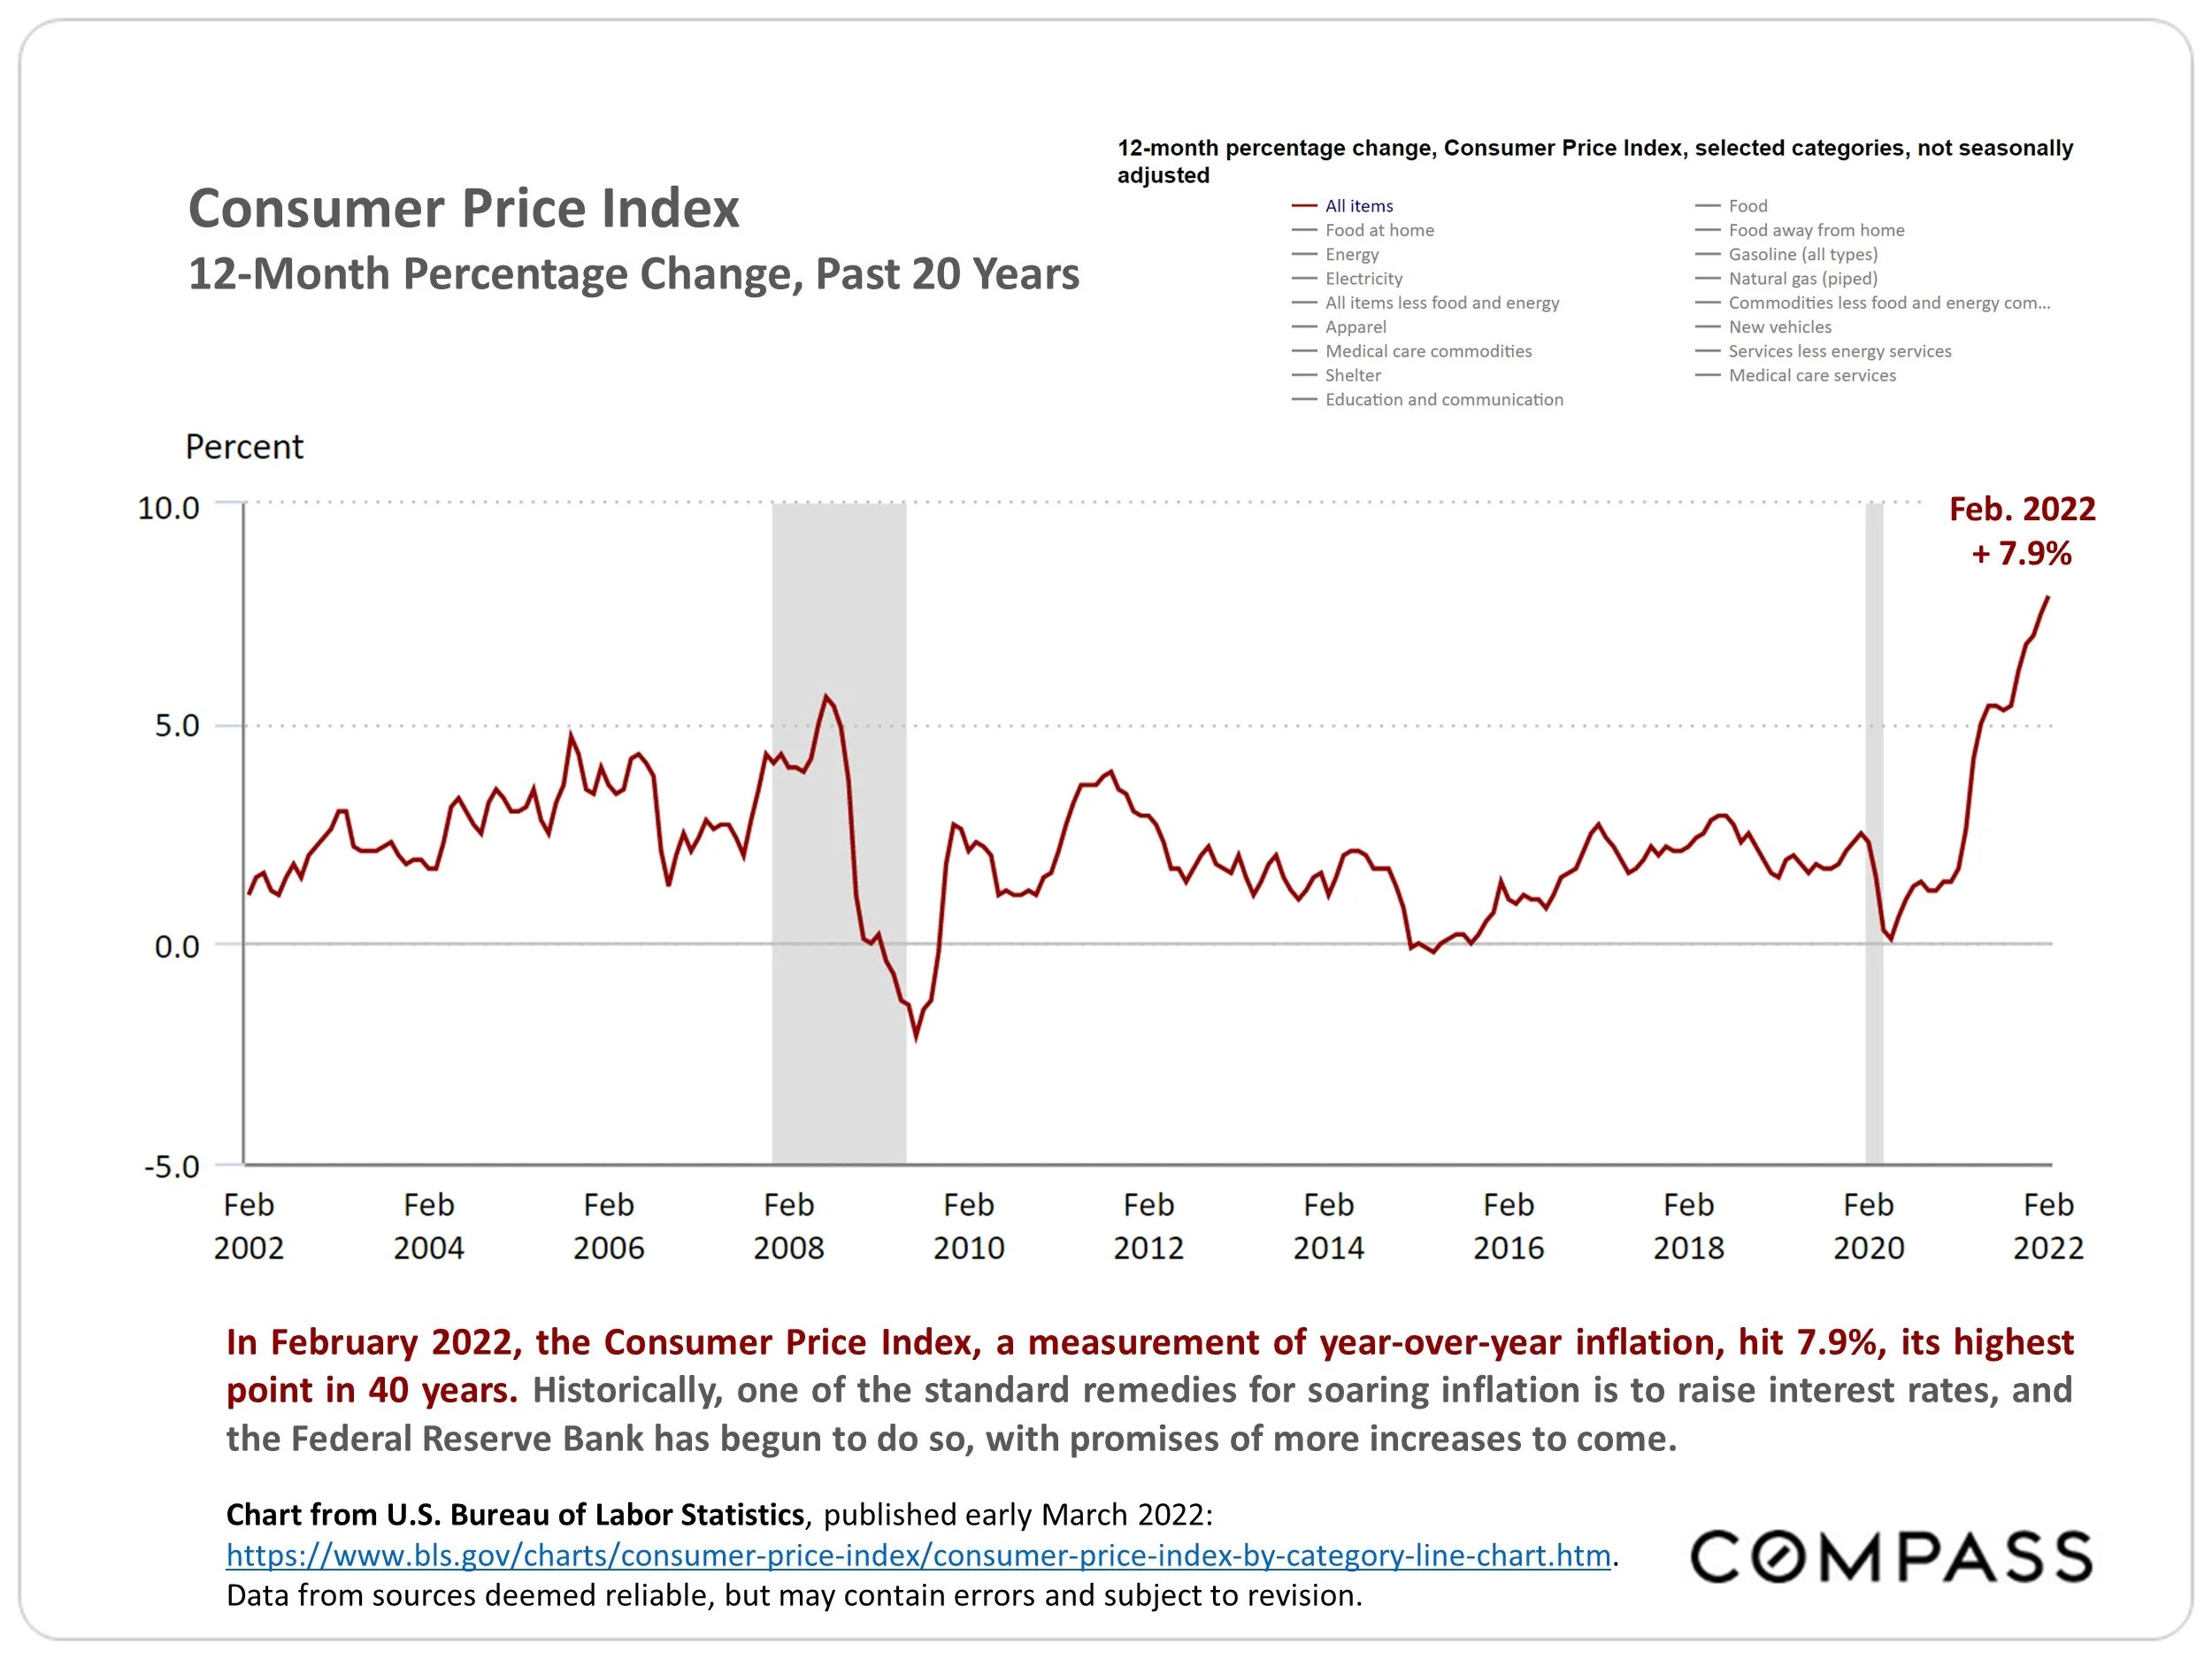
Chart from U.S. Bureau of Labor Statistics, published early March 2022: https://www.bls.gov/charts/consumer-price-index/consumer-price-index-by-category-line-chart.htm. Data from sources deemed reliable, but may contain errors and subject to revision.
In February 2022, the Consumer Price Index, a measurement of year-over-year inflation, hit 7.9%, its highest point in 40 years. Historically, one of the standard remedies for soaring inflation is to raise interest rates, and the Federal Reserve Bank has begun to do so, with promises of more increases to come.
Consumer Sentiment (Confidence) Index
University of Michigan, January 1978 – February 2022

University of Michigan: Consumer Sentiment [UMCSENT], retrieved from FRED, Federal Reserve Bank of St. Louis; https://fred.stlouisfed.org/series/UMCSENT. Not seasonally adjusted. 1966, Q1 = 100.
In early 2022, the consumer confidence reading hits its lowest point since 2011.
Statistics are generalities, essentially summaries of widely disparate data generated by dozens, hundreds or thousands of unique, individual sales occurring within different time periods. They are best seen not as precise measurements, but as broad, comparative indicators, with reasonable margins of error. Anomalous fluctuations in statistics are not uncommon, especially in smaller, expensive market segments. Last period data should be considered estimates that may change with late-reported data. Different analytics programs sometimes define statistics – such as “active listings,” “days on market,” and “months supply of inventory” – differently: what is most meaningful are not specific calculations but the trends they illustrate. Most listing and sales data derives from the local or regional multi-listing service (MLS) of the area specified in the analysis, but not all listings or sales are reported to MLS and these won’t be reflected in the data. “Homes” signifies real-property, single-household housing units: houses, condos, co-ops, townhouses, duets and TICs (but not mobile homes), as applicable to each market. City/town names refer specifically to the named cities and towns, unless otherwise delineated. Multi-county metro areas will be specified as such. Data from sources deemed reliable, but may contain errors and subject to revision. All numbers to be considered approximate.
Many aspects of value cannot be adequately reflected in median and average statistics: curb appeal, age, condition, amenities, views, lot size, quality of outdoor space, “bonus” rooms, additional parking, quality of location within the neighborhood, and so on. How any of these statistics apply to any particular home is unknown without a specific comparative market analysis.
Median Sales Price is that price at which half the properties sold for more and half for less. It may be affected by seasonality, “unusual” events, or changes in inventory and buying trends, as well as by changes in fair market value. The median sales price for an area will often conceal an enormous variety of sales prices in the underlying individual sales.
Dollar per Square Foot is based upon the home’s interior living space and does not include garages, unfinished attics and basements, rooms built without permit, patios, decks or yards (though all those can add value to a home). These figures are usually derived from appraisals or tax records, but are sometimes unreliable (especially for older homes) or unreported altogether. The calculation can only be made on those home sales that reported square footage.
Compass is a real estate broker licensed by the State of California, DRE 01527235. Equal Housing Opportunity. This report has been prepared solely for information purposes. The information herein is based on or derived from information generally available to the public and/or from sources believed to be reliable. No representation or warranty can be given with respect to the accuracy or completeness of the information. Compass disclaims any and all liability relating to this report, including without limitation any express or implied representations or warranties for statements contained in, and omissions from, the report. Nothing contained herein is intended to be or should be read as any regulatory, legal, tax, accounting or other advice and Compass does not provide such advice. All opinions are subject to change without notice. Compass makes no representation regarding the accuracy of any statements regarding any references to the laws, statutes or regulations of any state are those of the author(s). Past performance is no guarantee of future results.