April 2021 Market Report

Photo by Dale Cruse on Flickr via Creative Commons license
After all of the hullaballoo over the great exodus from San Francisco, a phenomenon is beginning to emerge: Anecdotally, I’ve had a bunch of buyers come out of the woodwork who fled the city in the early days of the pandemic and are now focusing their attention back, looking to get in the market as their employers begin to rethink entirely remote workforces. It will take time for the data to bear out on this, but I expect to see renewed interest in the condo market in San Francisco, especially as more people get vaccinated.
Q1 is typically a slow quarter, its sales and sales prices mostly reflecting activity during the mid-winter holiday “doldrums,” as the market gradually wakes up in the new year. But business went crazy this past winter sales peaked for the year in Q420—and this year’s first quarter activity was far higher than Q120.
Interest rates, though still extremely low by historical standards, have climbed 20% since their all-time low in January.
Q121 vs Q120, Selected Statistics
Median house sales price up 6.5%
Median 2BR condo price down 10.6%
Home sales volume up 60%
Luxury house sales up 51%
Luxury condo sales up 39%
San Francisco House Price Appreciation
Median House Sales Prices, 2012 — Present, by Quarter

Q1 columns highlighted: The Q1 2021 median house sales price was 6.5% higher than in Q1 2020.
Seasonal fluctuations are common, and it's not unusual for median sales prices to peak for the year in spring (Q2). Longer-term trends are more meaningful than short-term changes.
Median sales price is that price at which half the sales occurred for more and half for less. It is a very general statistic that can be affected by other factors besides changes in fair market value. All numbers are approximate and subject to revision. Last quarter may change with late reported sales.
San Francisco Median 2-BR Condo Sales Prices
Monthly Median Sales Prices, 3-Month Rolling Figures, Since 2010

Year-over-year, the Q1 2021 median sales price for 2-bedroom condos was down 10.6% from Q1 2020.
New Listings Coming on Market
San Francisco Market Dynamics & Seasonality

Active Listings on Market
San Francisco Real Estate Market Dynamics
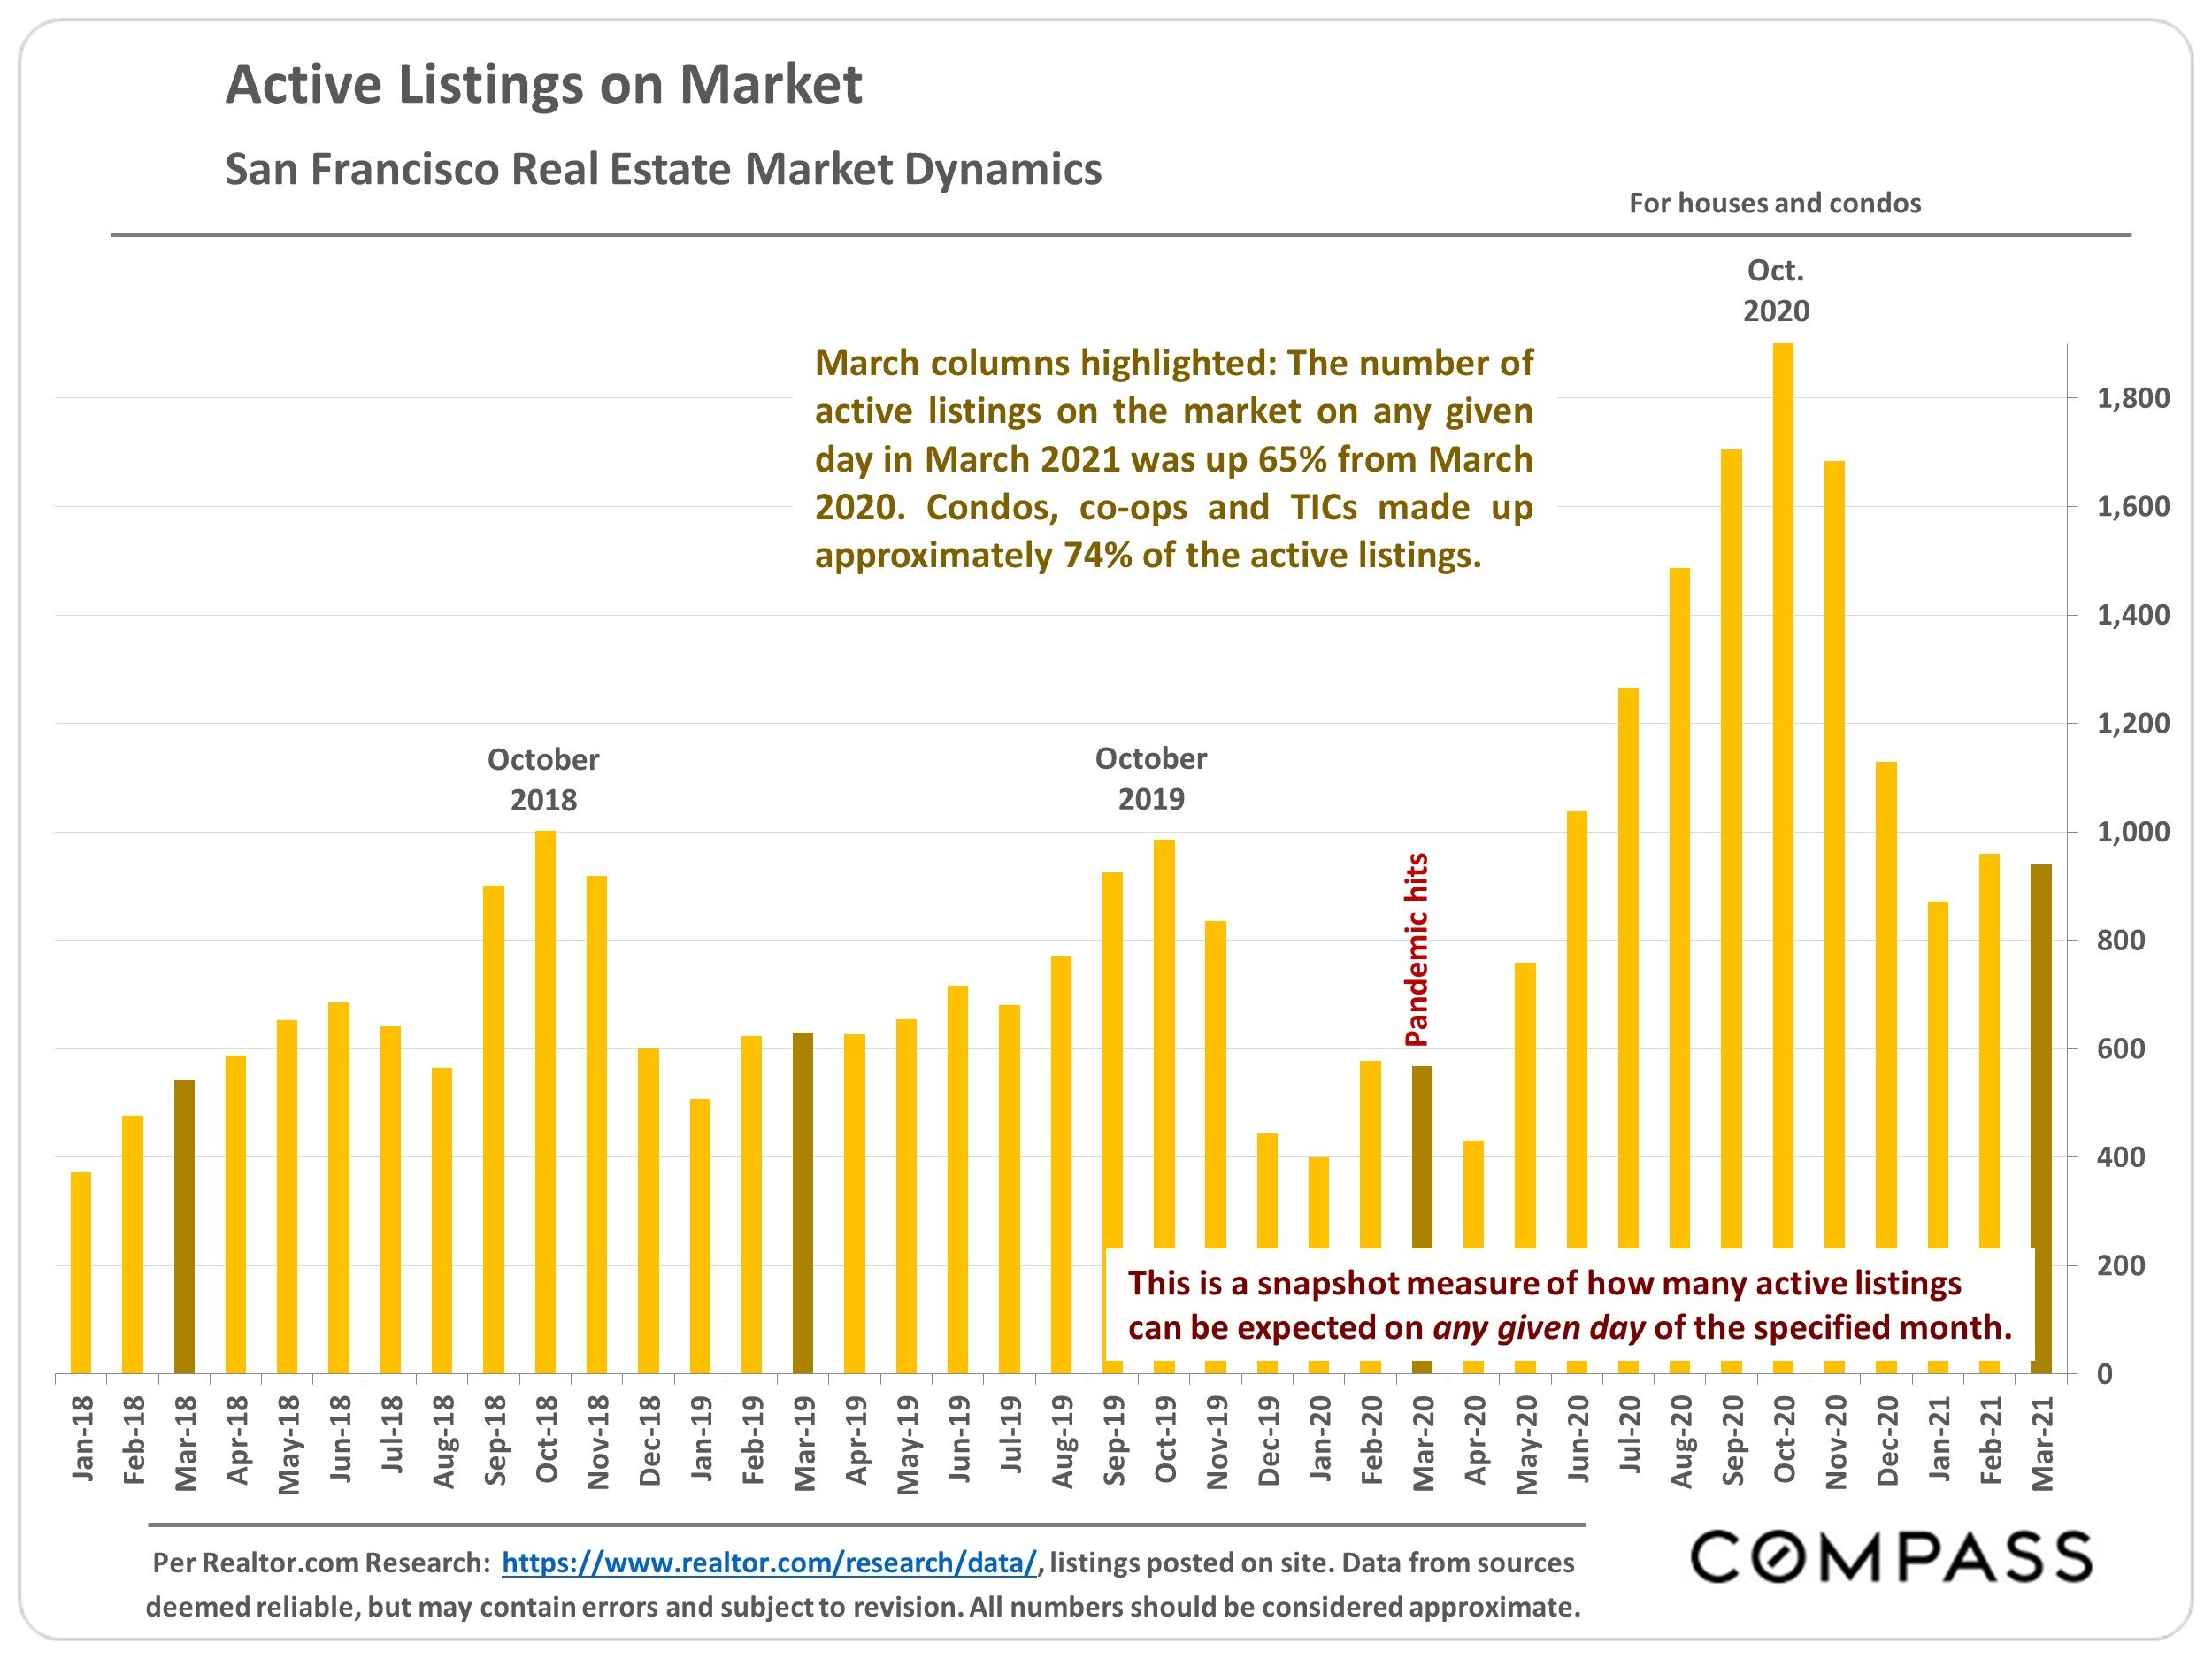
March columns highlighted: The number of active listings on the market on any given day in March 2021 was up 65% from March 2020. Condos, co-ops and TICs made up approximately 74% of the active listings.
Listings Pending Sale
San Francisco Real Estate Market Dynamics
For house and condo listings pending sale (in contract)

This is a snapshot measure of how many pending listings can be expected on any given day of the specified month. March columns highlighted: The number of listings pending sale on any given day in March 2021 was up 89% over March 2020.
Sales Volume by Quarter
San Francisco Market Dynamics since 2016

Q1 2021 sales volume was up approximately 60% Houses made up 37 and condos, co-ops & Q2 2019 year over year. % of Q1 2021 sales, TICs made up 63%. Sales are a lagging indicator, reflecting accepted offers 3-5 weeks earlier.
San Francisco Luxury Home Sales since 2018
Houses - $3 Million+, Condos - $2 Million+, by Quarter

In Q1 2021, luxury house sales were up 51% and luxury condo, co-op & TIC sales up 39% year over year.
Typically spring (Q2) is the dominant selling period for luxury home sales, but Q2 2020 was deeply affected by the pandemic before rebounding strongly in the following quarters.
Percentage of Listings Accepting Offers by Quarter
San Francisco Market Dynamics since late 2017

Q1 2021 percentages were the highest of any Q1 over the past 4 years. The higher the percentage of listings accepting offers (going into contract), the stronger the buyer demand as compared to the supply of listings for sale.
Average Days on Market by Quarter
San Francisco Market Dynamics since 2019

On average, houses continue to go into contract much more quickly than condos, co-ops and TICs. The difference grew much wider since the pandemic hit.
Overbidding List Prices in San Francisco
Percentage of Sales Closing over List Price, since 2015
6-month rolling sales data reported to MLS through 3/31/21, per Infosparks
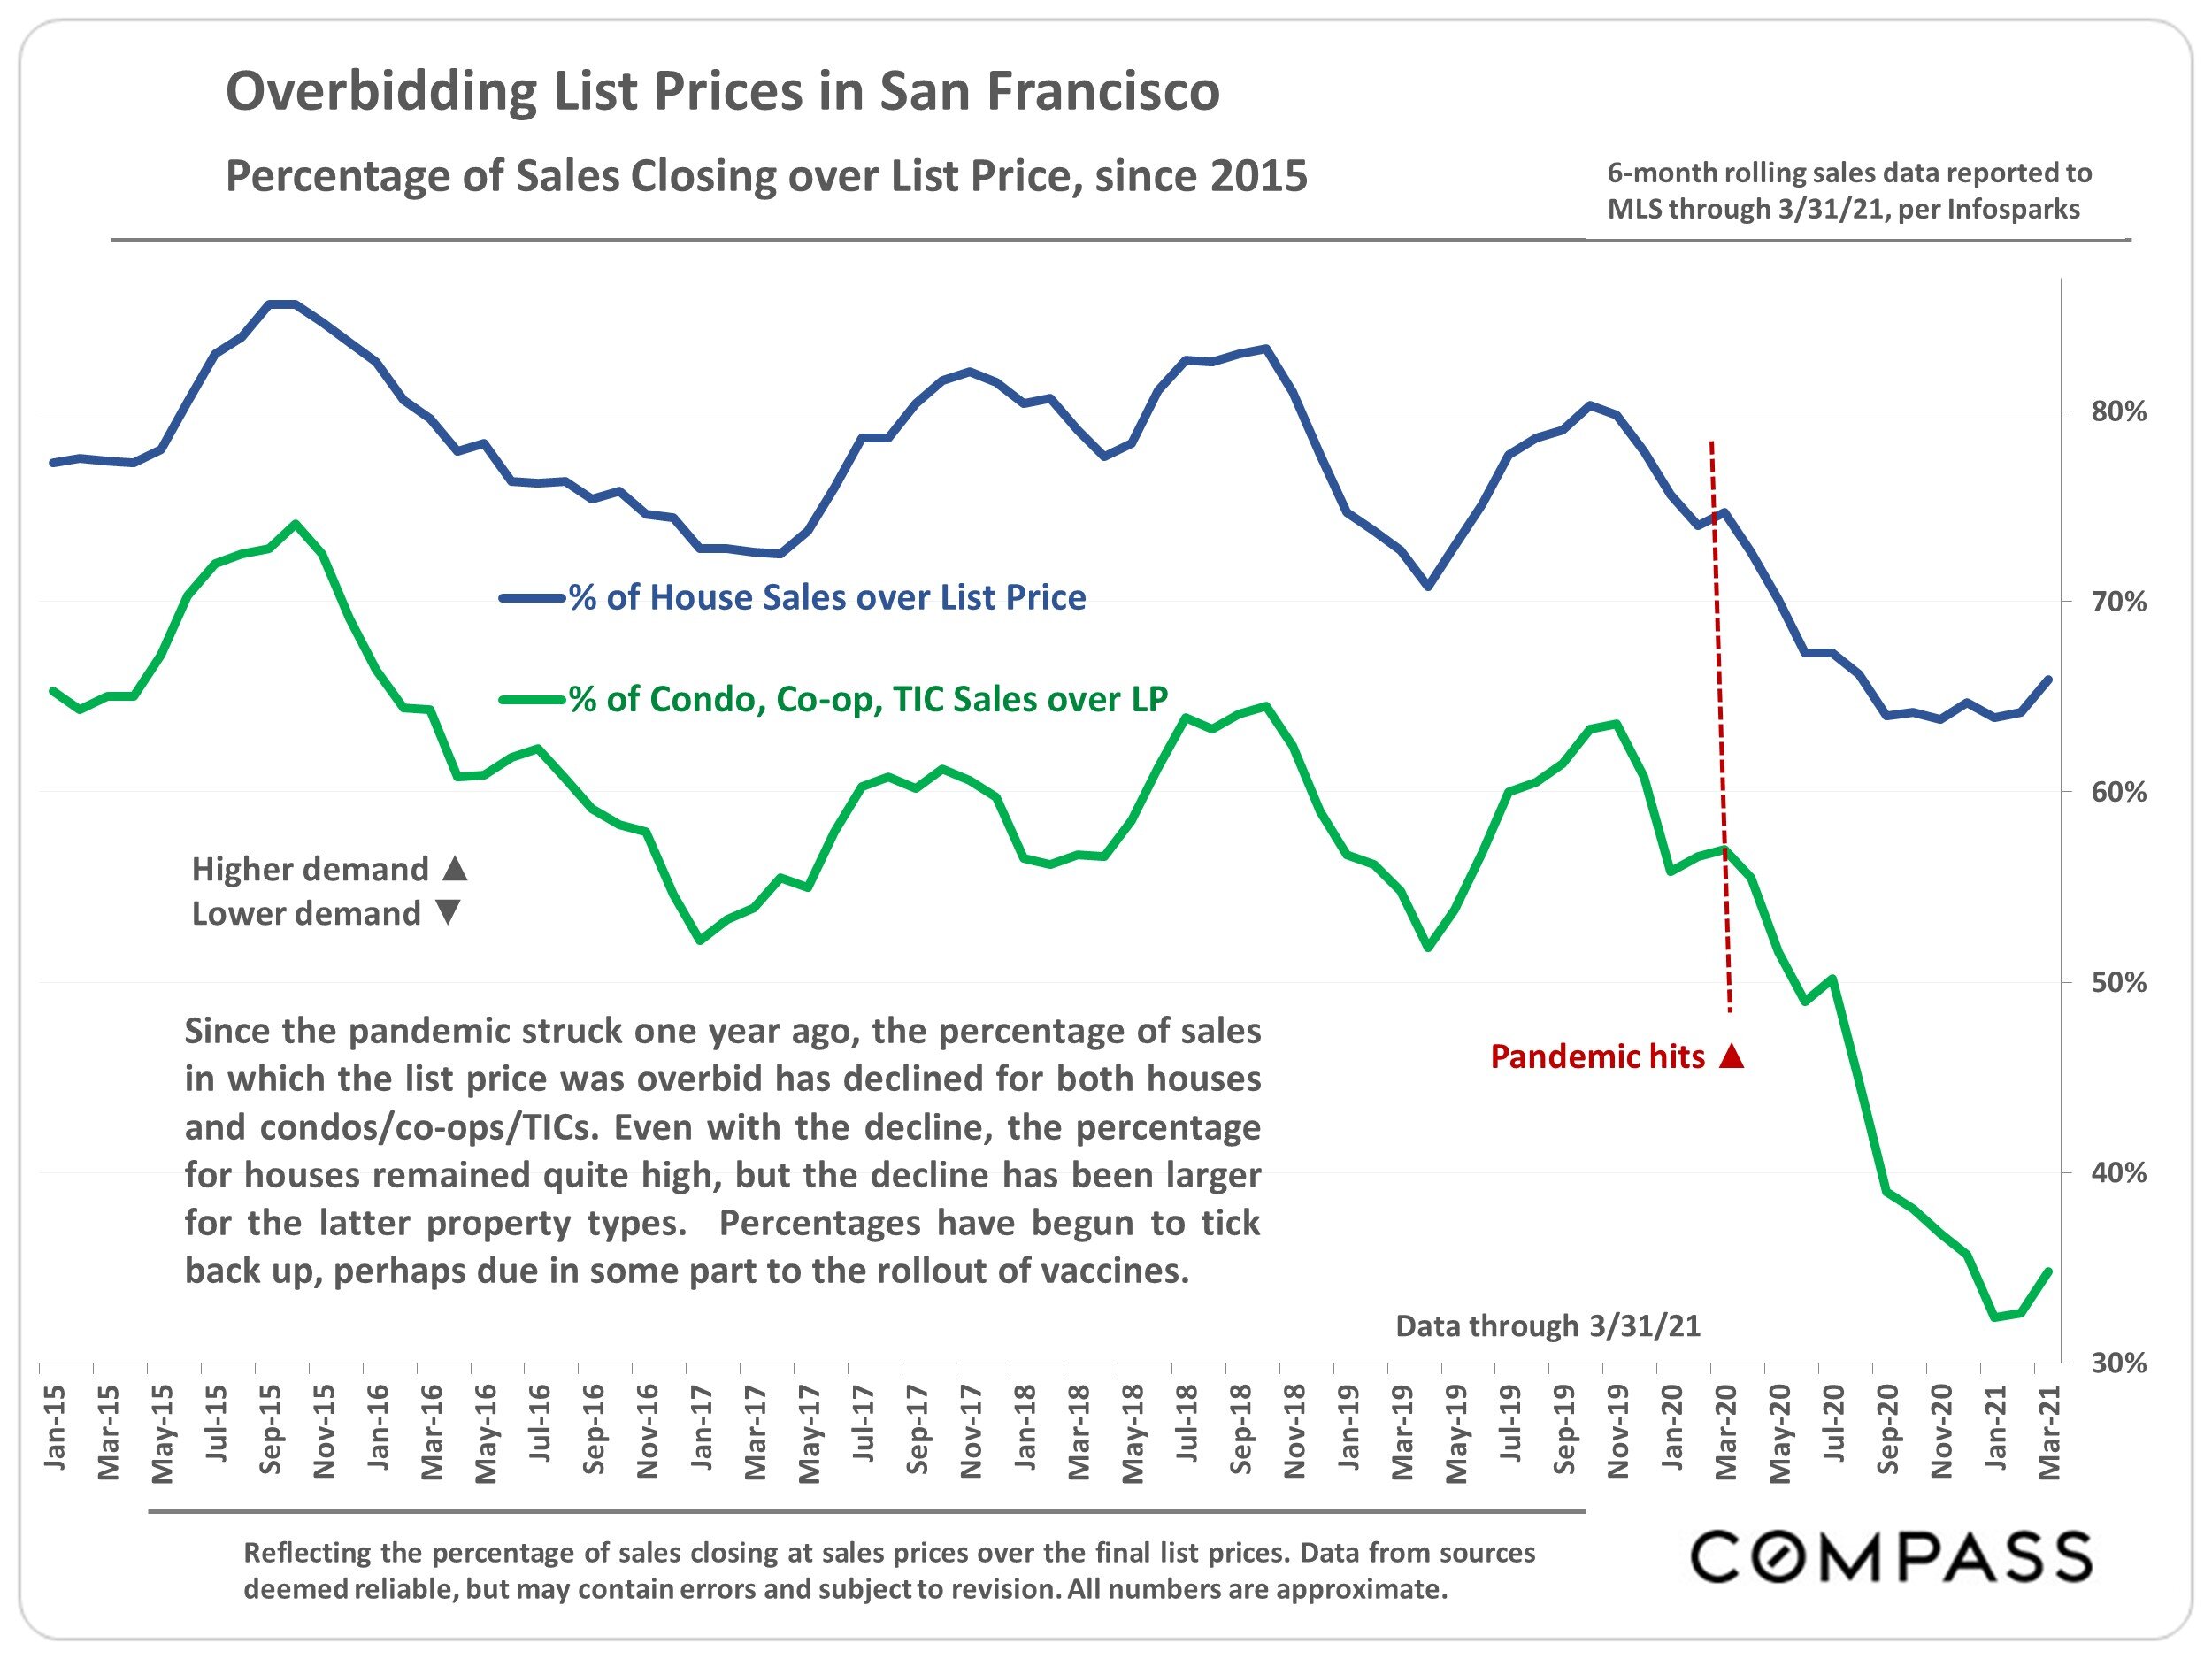
Since the pandemic struck one year ago, the percentage of sales in which the list price was overbid has declined for both houses and condos/co-ops/TICs. Even with the decline, the percentage for houses remained quite high, but the decline has been larger for the latter property types. Percentages have begun to tick back up, perhaps due in some part to the rollout of vaccines.
Sales Price to Original List Price (SP-OP) Percentage by Quarter
San Francisco Market Dynamics since 2018

On average, house list prices were overbid by 5% during Q1 2021, and condo list prices slightly underbid. SP-OP percentages remain well down from 2018. 100% signifies an average sales price at original list price.
Comparative Review of Neighborhood & District Markets
Supply and demand trends — represented by statistics such as supply of inventory, home-price appreciation, time on market, overbidding asking prices, and so on — that characterize the city's overall market also, unsurprisingly, generally pertain to its districts and neighborhoods. But there are often significant differences in dynamics between neighborhoods tied to the specific balance (or imbalance) between buyer demand and the supply of listings for sale.
Property type — house or condo (small building or high-rise) — and how affordable or expensive an individual market is within the context of San Francisco's general cost of housing are often the major factors — though there are certainly other economic and demographic issues at play. In real estate, the devil is always in the details.
The following analyses review and compare San Francisco house and condo neighborhoods by a number of statistical measures.
There is a map delineating the city's many neighborhoods following the graphs and tables.
Statistics are generalities and anomalous fluctuations in statistics are not uncommon, especially in smaller district and neighborhood markets with fewer sales and wide ranges in sales prices.
San Francisco House Sales Statistics
6 Months Sales through Mid-March 2021

San Francisco Home Sizes
Median HOUSE Square Footage — Selected Neighborhoods

Comparing median sales prices between neighborhoods is not apples to apples, since the median sizes of homes vary so widely. Generally speaking, the most expensive neighborhoods have both the largest homes and the highest dollar per square foot values.
Square footage is based upon interior living space and doesn't include garages, attics, basements, rooms built without permit, decks, patios or lot size.
Median home sizes can vary widely between time periods. Within neighborhoods home sizes vary enormously. Data from sources deemed reliable, but may contain errors and subject to revision. All numbers are approximate.
San Francisco Condo Sales Statistics
6 Months Sales of 2-Bedroom, 2-Bath Condos

Sales Price to List Price Differences
on San Francisco Home Sales Accepting Offers within 30 Days

Illustrating average % differences between sales and list prices on homes which sold quickly — i.e. went into contract within 30 days of coming on market.
Positive percentages = overbidding asking price, while negative percentages (South Beach and Mission Bay condos) signify underbidding. Overbidding most typically occurs on brand new listings.
On average, the sales price of houses accepting offers within 30 days was 8.9% above list price, and for condos 2.9% higher.
Mortgage Interest Rate Trends, 2016 — Present
30-Year Conforming Fixed-Rate Loans, Weekly Average Readings
Rates published by the FHLMC, January 7, 2016 — Present

Per Freddie Mac on April 1 2021 the weekly average 30-year interest rate was 3.18%, up from the all-time low of 2.65% in early January. In November 2018, the rate hit 4.94%. In 2007, the average was 6.3%.